

Magnetic resonance imaging quantifies causal body compartment effects on metabolic traits via immune phenotypes-a Mendelian randomisation study
- PMID: 41126336
- PMCID: PMC12541995
- DOI: 10.1186/s12967-025-07241-4
Magnetic resonance imaging quantifies causal body compartment effects on metabolic traits via immune phenotypes-a Mendelian randomisation study
Abstract
Background: Metabolic diseases, including type 2 diabetes (T2D), hypertension, hyperlipidemia and metabolic dysfunction-associated fatty liver disease (MAFLD), are globally prevalent. However, traditional measures, such as body mass index (BMI), fail to capture body composition heterogeneity to accurately predict metabolic diseases. Magnetic resonance imaging (MRI) provides a precise quantification of body composition; however, the causal links among these compartments, immune phenotypes, and metabolic traits remain unclear. This Mendelian randomisation (MR) study aimed to investigate the compartment-specific effects of MRI-derived body composition measures on metabolic diseases and assess the mediating role of immune phenotypes.
Methods: Using a two-sample MR framework, genetic instruments for 10 MRI-assessed body composition traits were derived from GWAS data. The outcomes included metabolic diseases (T2D, MAFLD, and hypertension) and glycolipid metabolism traits. Mediation analysis integrated 731 immune cell types. Robustness was assessed using the MR-Egger, Weighted Median, and MR-PRESSO methods, addressing pleiotropy and heterogeneity.
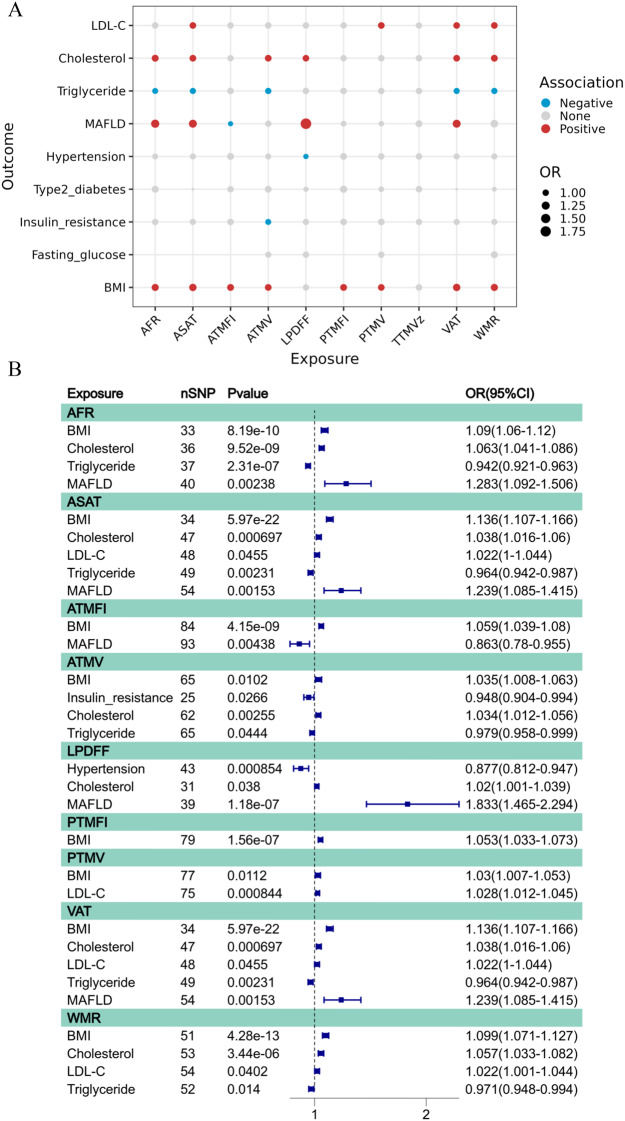
Results: Visceral adipose tissue (VAT) and abdominal subcutaneous adipose tissue (ASAT) exerted strong causal effects on BMI (odds ratio [OR] = 1.136). The strongest causal effect on MAFLD risk was observed for liver proton density fat fraction (LPDFF) (OR = 1.833). VAT, weight-muscle ratio and ASAT positively influenced levels of low-density lipoprotein cholesterol (LDL-C) and total cholesterol, whereas they negatively influenced triglyceride levels. Immune phenotypes mediated 28 causal pathways: ectopic fat promoted pro-inflammatory immune profiles, transitional B cells and Memory-CD8+ T cells expanded positive correlation with BMI. CD14+ monocytes and CD16+ monocytes positively regulate Cholesterol and LDL-C levels, respectively.
Conclusion: Our study emphasised the correlation between MRI-derived body composition measures and metabolic diseases, particularly revealing VAT, subcutaneous adipose tissue, and liver proton density fat fraction as key causal drivers of metabolic diseases while uncovering the pivotal role of immune phenotypes in mediating these metabolic pathways. These findings support the integration of MRI-based body composition profiling into clinical screening for metabolic diseases of high-risk cohorts, and provide a novel theoretical foundation for immune-targeted therapies to combat metabolic dysregulation.
Keywords: Immune phenotypes; MRI-profiled body composition; Mendelian randomisation; Metabolic diseases.
© 2025. The Author(s).
Conflict of interest statement
Declarations. Ethics approval and consent to participate: Since this study relied on publicly available summary statistics from GWAS, ethics approval was not required. The respective ethics approvals for the GWAS were obtained by the relevant investigators. Consent for publication: Not applicable. Competing interests: The authors declare that they have no other competing interests.
Figures


References
-
- Neeland IJ, Ross R, Després JP, Matsuzawa Y, Yamashita S, Shai I, et al. Visceral and ectopic fat, atherosclerosis, and cardiometabolic disease: a position statement. Lancet Diabetes Endocrinol. 2019;7(9):715–25. - PubMed
-
- Hotamisligil GS. Inflammation and metabolic disorders. Nature. 2006;444(7121):860–7. - PubMed
-
- Rocha VZ, Libby P. Obesity, inflammation, and atherosclerosis. Nat Reviews Cardiol. 2009;6(6):399–409. - PubMed
MeSH terms
Grants and funding
LinkOut - more resources
Full Text Sources
Medical
Research Materials
