. 2025 Oct;29(20):e70914.
doi: 10.1111/jcmm.70914.

Renoprotective Effects of MIT-001 in Ischemia-Reperfusion Injury: Modulation of Ferroptosis, ROS and Fibrotic Markers

Affiliations

Renoprotective Effects of MIT-001 in Ischemia-Reperfusion Injury: Modulation of Ferroptosis, ROS and Fibrotic Markers

Jin Ah Shin et al. J Cell Mol Med. 2025 Oct.

Abstract

Renal ischemia-reperfusion injury (IRI) is a key driver of the progression from acute kidney injury (AKI) to chronic kidney disease (CKD), primarily through mechanisms involving oxidative stress, ferroptosis, and inflammation that promote fibrotic remodelling. This study investigates the therapeutic potential of MIT-001, a mitochondria-targeted reactive oxygen species (ROS) scavenger, in mitigating renal IRI. In vitro, MIT-001 attenuated ferroptotic cell death and fibrotic responses in HK-2 cells challenged with TGF-β or RSL3. MIT-001 restored GPX4 expression and activity, activated Nrf2 signalling, reduced lipid ROS and suppressed fibrogenic markers (α-SMA, Snail, collagen IV), while preserving E-cadherin levels. In a bilateral renal IRI mouse model, administration of MIT-001 significantly improved renal function and histology. Oxidative stress (DHE staining), apoptosis (TUNEL) and ferroptosis (4-HNE, xCT, GPX4) were markedly reduced. Additionally, MIT-001 inhibited the NF-κB/HMGB1 inflammatory axis and enhanced antioxidant defence via the Nrf2/HO-1 pathway, resulting in decreased immune infiltration and fibrosis. These findings demonstrate that MIT-001 confers renal protection by concurrently targeting oxidative stress, ferroptosis and inflammation, underscoring its promise as a therapeutic strategy to prevent AKI-to-CKD progression.

Keywords: MIT‐001; chronic kidney disease; ferroptosis; ischemia–reperfusion injury; oxidative stress; renal fibrosis.


Conflict of interest statement

The authors declare no conflicts of interest.

Figures

FIGURE 1
FIGURE 1
Effect of MIT‐001 on TGF‐β treated HK2 cells. (A) Expression of MnSOD, GPX4 and UCP1 mRNA in HK‐2 cells. (B) Representative Western blot results: xCT and GPX4 protein expression were decreased in HK‐2 cells after treatment with transgenic growth factor‐beta (TGF‐β). In these cells, the expression of xCT and GPX4 protein was gradually increased after treatment with various concentrations of MIT‐001. Protein and mRNA expression of 4‐HNE were increased in HK‐2 cells after TGF‐β treatment. (C) Osteopontin and MCP‐1 mRNA were overexpressed in HK‐2 cells treated with TGF‐β, then subsequently downregulated after MIT‐001 treatment. (D) Representative Western blot results: In HK‐2 cells treated with TGF‐β, E‐cadherin protein expression decreased and collagen IV and alpha smooth muscle actin (α‐SMA) protein expression increased. After those cells were subsequently treated with MIT‐001, E‐cadherin protein expression increased and collagen IV and α‐SMA protein expression decreased. *p < 0.01, **p < 0.001.
FIGURE 2
FIGURE 2
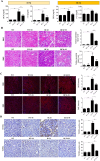
MIT‐001 Inhibits Ferroptosis. (A) In vitro comparative analysis of MIT‐001 and Fer‐1 on LDH inhibition after RSL3 (0.3 μM) treatment. EC50 values of MIT‐001 and Fer‐1 were decreased when RSL3 (0.3 μM) was treated together in HK‐2 cells. (B) After RSL3 (0.75 μM) treatment, MIT‐001 (0.001, 0.01 and 0.1 μM) reduced lipid ROS and mitochondrial ROS levels in HK‐2 cells. (C) GSH assay. Detection of GSH in HK‐2 cells administered RSL3 (0.3 μM) and treated with MIT‐001 (0.001, 0.01 and 0.1 μM). GSH levels recover upon treatment by concentration of MIT‐001. (D) MIT‐001 treatment group increases the mRNA level and protein expression level of GPX4 and upregulates the enzyme activity of GPX4 in HK‐2 cells. (E) MIT‐001 increases the protein expression of Nrf2 and GPX4, but the protein expression of xCT is not significantly different compared to RSL3‐only treatment in HK‐2 cells. (F) Iron homeostasis‐related protein level. MIT‐001 increases the protein expression of NCOA4, FTH1 and FTL in HK‐2 cells (0.001, 0.01 and 0.1 μM). (G) Renal function after renal ischemia–reperfusion injury (IRI) in mice. Blood urea nitrogen (BUN) and serum creatinine (s‐Cr) levels were significantly decreased in both IR 3d + M and IR 3d + F compared with IR 3d, and a similar pattern was observed at Day 7. (H) Representative kidney section with haematoxylin and eosin staining after renal IRI in mice. Dilated renal tubules, tubular necrosis, and inflammatory cell infiltration indicate tubulointerstitial damage at Days 3 and 7 after IRI, whereas treatment with MIT‐001 or ferrostatin‐1 significantly improved the tubulointerstitial damage score. 200× original magnification. Scale bar = 100 μm. IR 3d, untreated Day 3 renal IRI wild‐type mice (n = 7); IR 3d + M, Day 3 renal IRI mice treated with MIT‐001 (n = 7); IR 3d + F, Day 3 renal IRI mice treated with ferrostatin‐1 (n = 7); IR 7d, untreated Day 7 renal IRI mice (n = 7); IR 7d + M, Day 7 renal IRI mice treated with MIT‐001 (n = 7); IR 7d + F, Day 7 renal IRI mice treated with ferrostatin‐1 (n = 7). Bar charts show means ± standard deviation. Kruskal–Wallis H test, followed by a post hoc Bonferroni correction *p < 0.01, **p < 0.001, ***p < 0.001.
FIGURE 3
FIGURE 3
Renal function and histology after ischemia–reperfusion injury (IRI) in wild‐type mice. (A) Blood urea nitrogen and serum creatinine (s‐Cr) levels were significantly decreased in both IR 3d + M and IR 7d + M mice. (B) Typical kidney sections with haematoxylin and eosin staining. Dilated renal tubules, tubular necrosis, and inflammatory cell infiltration indicate tubulointerstitial damage. 200× original magnification. Scale bar = 100 μm. (C) Representative micrographs of dihydroethidium (DHE) staining in renal sections, quantified by fluorescence intensity. 200× original magnification. Scale bar = 50 μm. (D) Representative TUNEL‐stained renal sections. 400× original magnification. Scale bar = 200 μm. WT, wild‐type mice, sham treatment (n = 5 for 3d, n = 5 for 7d); WT + M, wild‐type mice treated with MIT‐001 (n = 7 for 3d, n = 7 for 7d); IR 3d, untreated Day 3 renal IRI wild‐type mice (n = 10); IR 3d + M, Day 3 renal IRI mice treated with MIT‐001 (n = 10); IR 7d, untreated Day 7 renal IRI mice (n = 10); IR 7d + M, Day 7 renal IRI mice treated with MIT‐001 (n = 10) (0.001, 0.01 and 0.1 μM). Bar charts show means ± standard deviation. Kruskal–Wallis H test, followed by a post hoc Bonferroni correction *p < 0.01, **p < 0.001.
FIGURE 4
FIGURE 4
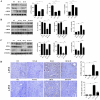
Anti‐ferroptosis effect of MIT‐001 in the kidneys of mice with ischemia–reperfusion injury (IRI). (A) Representative Western blot results for renal lysis: XCT and GPX4 protein expression decreased and 4‐HNE protein expression increased in the kidneys of IR 3d and IR 7d mice compared with the kidneys of wild‐type (WT) mice. (B) Representative Western blot results for renal lysis: XCT and GPX4 protein expression increased and 4‐HNE protein expression decreased in the kidneys of IR 3d + M mice compared with the kidneys of IR 3d mice. (C) Representative Western blot results for renal lysis: XCT and GPX4 protein expression increased and 4‐HNE protein expression decreased in the kidneys of IR 7d + M mice compared with the kidneys of IR 7d mice. (D) Representative Immunohistochemical kidney sections. Immunohistochemical staining with lipid peroxidation marker 4‐HNE showed a significant decrease in 4‐HNE expression in the kidneys of IR 3d + M and IR 7d + M mice. 200× original magnification. Scale bar = 50 μm. Bar charts show means ± standard deviation (whiskers). WT, wild‐type mice, sham treatment; WT + M, wild‐type mice treated with MIT‐001; IR 3d, untreated Day 3 renal IRI wild‐type mice; IR 3d + M, Day 3 renal IRI mice treated with MIT‐001; IR 7d, untreated Day 7 renal IRI mice; IR 7d + M, Day 7 renal IRI mice treated with MIT‐001. *p < 0.01, **p < 0.001.
FIGURE 5
FIGURE 5
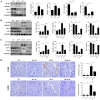
MIT‐001 protects against ischemia–reperfusion injury (IRI)–induced reactive inflammation in the kidney. (A–C) Representative Western blot results for kidney lysis: NF‐κB and HMGB1 expression decreased, and HO‐1 and Nrf2 expression increased in the kidneys of IR 3d + M and IR 7d + M mice compared with the kidneys of IR 3d and IR 7d mice. There was no significant difference in the kidneys of WT and WT + M mice. (D) Representative immunohistochemical kidney sections. Immunohistochemical staining using the macrophage marker F4/80 showed a significant decrease in F4/80 expression in the kidneys of IR 3d + M and IR 7d + M mice. 400× original magnification. Scale bar = 200 μm. WT, wild‐type mice, sham treatment (n = 5 for 3d, n = 5 for 7d); WT + M, wild‐type mice treated with MIT‐001 (n = 7 for 3d, n = 7 for 7d); IR 3d, untreated Day 3 renal IRI wild‐type mice (n = 10); IR 3d + M, Day 3 renal IRI mice treated with MIT‐001 (n = 10); IR 7d, untreated Day 7 renal IRI mice (n = 10); IR 7d + M, Day 7 renal IRI mice treated with MIT‐001 (n = 10). Bar charts show means ± standard deviation. Kruskal–Wallis H test, followed by a post hoc Bonferroni correction *p < 0.01, **p < 0.001.
FIGURE 6
FIGURE 6
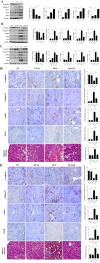
Effect of MIT‐001 on renal fibrosis. (A) Representative Western blot results for renal lysis: E‐cadherin protein expression decreased and collagen IV, α‐SMA, Snail and Twist protein expression increased in the kidneys of IR 3d and IR 7d mice compared with the kidneys of WT mice. (B) Representative Western blot results for renal lysis: E‐cadherin expression increased and collagen IV, α‐SMA, Snail and Twist protein expression decreased in the kidneys of IR 3d + M mice compared with the kidneys of IR 3d mice. (C) Representative Western blot results for renal lysis: E‐cadherin protein expression increased and collagen IV, α‐SMA, Snail and Twist protein expression decreased in the kidneys of IR 7d + M mice compared with the kidneys of IR 7d mice. (D, E) Representative immunohistochemical staining of kidney sections of IR 3d and IR 7d respectively. Staining was performed using cell–cell conjugated protein for epithelial cell marker E‐cadherin, epithelial and endothelial cell marker collagen IV, myofibroblast marker α‐SMA, and multiple cytokine TGF‐β. Representative photomicrographs of kidney sections stained with Masson trichrome are also presented. 200× original magnification. Scale bar = 100 μm. WT, wild‐type mice, sham treatment (n = 5 for 3d, n = 5 for 7d); WT + M, wild‐type mice treated with MIT‐001 (n = 7 for 3d, n = 7 for 7d); IR 3d, untreated Day 3 renal IRI wild‐type mice (n = 10); IR 3d + M, Day 3 renal IRI mice treated with MIT‐001 (n = 10); IR 7d, untreated Day 7 renal IRI mice (n = 10); IR 7d + M, Day 7 renal IRI mice treated with MIT‐001 (n = 10). Bar charts show means ± standard deviation. Kruskal‐Wallis H test, followed by a post hoc Bonferroni correction *p < 0.01; **p < 0.001.
FIGURE 7
FIGURE 7
A schematic diagram showing how renal IRI increases renal injury and how MIT‐001 attenuates the resulting fibrosis. In IRI mice, increased lipid ROS induces ferroptosis, and HMGB1/NF‐κB signalling increases inflammation, contributing to renal fibrosis. However, MIT‐001 can activate MnSOD, UPC1, Nrf2, HO‐1 and Gpx4 and inhibit NCOA4, FTHL1, FTL and HMGB1/NF‐κB signalling, thereby improving IRI‐induced ferroptosis and fibrosis.

References

    1. Li D., Zhang J., Yuan S., et al., “TGF ‐β1 peptide‐based inhibitor P144 ameliorates renal fibrosis after ischemia–reperfusion injury by modulating alternatively activated macrophages,” Cell Proliferation 55, no. 10 (2022): e13299, 10.1111/cpr.13299. - DOI - PMC - PubMed
    1. Guan Y., Nakano D., Zhang Y., Li L., Tian Y., and Nishiyama A., “A Mouse Model of Renal Fibrosis to Overcome the Technical Variability in Ischaemia/Reperfusion Injury Among Operators,” Scientific Reports 9 (2019): 10435, 10.1038/s41598-019-46994-z. - DOI - PMC - PubMed
    1. Tanaka S., Tanaka T., and Nangaku M., “Hypoxia as a Key Player in the AKI‐To‐CKD Transition,” American Journal of Physiology. Renal Physiology 307, no. 11 (2014): F1187–F1195, 10.1152/ajprenal.00425.2014. - DOI - PubMed
    1. Chen Y., Fang Z. M., Yi X., Wei X., and Jiang D. S., “The Interaction Between Ferroptosis and Inflammatory Signaling Pathways,” Cell Death & Disease Mar 21 14, no. 3 (2023): 205, 10.1038/s41419-023-05716-0. - DOI - PMC - PubMed
    1. Yan H. F., Zou T., Tuo Q. Z., et al., “Ferroptosis: Mechanisms and Links With Diseases,” Signal Transduction and Targeted Therapy 6 (2021): 49, 10.1038/s41392-020-00428-9. - DOI - PMC - PubMed

MeSH terms