Review
. 2025 Oct;62(8):e70276.
doi: 10.1111/ejn.70276.

Resting-State Functional MRI Analyses for Brain Activity Characterization: A Narrative Review of Features and Methods

Affiliations
Review

Resting-State Functional MRI Analyses for Brain Activity Characterization: A Narrative Review of Features and Methods

Alejandro Amador-Tejada et al. Eur J Neurosci. 2025 Oct.

Abstract

Resting-state fMRI (rsfMRI) is a widely used neuroimaging technique that measures spontaneous fluctuations in brain activity in the absence of specific external cognitive, motor, emotional, and sensory tasks or stimuli, based on the blood-oxygen-level-dependent (BOLD) signal. Functional connectivity (FC) is a popular rsfMRI analysis examining BOLD signal correlations between brain regions. Nevertheless, there are alternative analyses that provide different but collectively informative characteristics of the BOLD signal and, thus, brain activity. This narrative review aimed to provide a comprehensive conceptual, mathematical, and significance investigation of common rsfMRI analyses in addition to FC. To achieve this, a narrative review was conducted on studies using the most common rsfMRI analysis to investigate global and local brain activity. Five rsfMRI analyses were described, summarizing the common initial steps of rsfMRI data processing and explaining the main characteristics and how each metric is calculated. The rsfMRI analyses described are (1) FC, reflecting BOLD global connectivity; (2) the amplitude of low-frequency fluctuations (ALFF) and fractional ALFF (fALFF), representing the intensity of the BOLD signal; (3) regional homogeneity (ReHo), which reflects BOLD local connectivity; (4) Hurst exponent (H), depicting autocorrelation of the BOLD signal; and (5) entropy, depicting the BOLD signal predictability. As rsfMRI is a vital tool for exploring brain function, selecting an analysis that aligns with the research question is essential. This review offers an initial catalog of standard rsfMRI analyses, highlighting their key features, concepts, and considerations to support informed decisions by researchers and clinicians.

Keywords: blood‐oxygen‐level‐dependent (BOLD) signal; functional magnetic resonance imaging (fMRI); global brain activity; local brain activity; low‐frequency fluctuations; neuroimaging; resting state.


Conflict of interest statement

Dr. Noseworthy is the co‐founder and CEO of TBIFinder Inc., a data analytics company that focuses on brain injury. Also, Dr. Danielli and Mr. Amador‐Tejada are part‐time research interns with TBIFinder Inc. There is no overlap between TBIFinder and the current research presented in this review.

Figures

FIGURE 1
FIGURE 1
Plot illustrating the number of publications from 1995 to 2024 related to all types of rsfMRI analyses (blue). The number of publications specifically focused on FC is shown in red. The grey line represents the percentage of rsfMRI publications dedicated to FC analysis, calculated as #functional connectivity publications#rsfMRI publications×100%. The keywords to generate this plot are shown in Table 1.
FIGURE 2
FIGURE 2
(a) Cocktail party analogy, where everyone records their talks through the night. (b) FC represents people in the room talking similarly to a specific person shown in the red square. (c) ReHo measures how similar a radius of people are talking to the person at the center. ReHo is computed for each person in the room. The red color scale represents the strength of similarity. (d) ALFF depicts how loud each person is talking in a low pitch, while fALFF normalizes this measurement by the entire frequency range of the conversation. (e) H represents how random or consistent each person is speaking. Lastly, entropy shows how regular and predictable or spontaneous and expressive each person speaks.
FIGURE 3
FIGURE 3
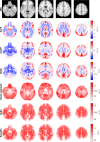
Plot showing a voxel‐wise average of each rsfMRI analysis. Five brain slices are shown, where the colormap represents the output value for each analysis. It is noted that ALFF, fALFF, and ReHo maps are normalized by subtracting the mean and dividing by the standard deviation. rsfMRI datasets from 14 healthy participants (50:50 sex ratio, 18–22 years old) were retrieved from INDI (available at https://www.nitrc.org/projects/fcon_1000/), from the Beijing Normal University, State Key Laboratory of Cognitive Neuroscience and Learning Enhanced Sample. Each rsfMRI analysis was applied to each dataset, producing 14 output maps per analysis. Subsequently, the mean voxel‐wise value was computed for each rsfMRI analysis.
FIGURE 4
FIGURE 4
Plot showing the distribution of voxel‐wise averages of each rsfMRI analysis. The histograms show whole‐brain output values for each analysis. These histograms show the dynamic range, mean, and standard deviation of each analysis. To note that ALFF, fALFF, and ReHo maps are normalized by subtracting the mean and dividing by the standard deviation. rsfMRI datasets from 14 healthy participants (50:50 sex ratio, 18–22 years old) were retrieved from INDI (available at https://www.nitrc.org/projects/fcon_1000/), from the Beijing Normal University, State Key Laboratory of Cognitive Neuroscience and Learning Enhanced Sample.

References

    1. Allen, E. A. , Damaraju E., Plis S. M., Erhardt E. B., Eichele T., and Calhoun V. D.. 2014. “Tracking Whole‐Brain Connectivity Dynamics in the Resting State.” Cerebral Cortex 24, no. 3: 663–676. 10.1093/cercor/bhs352. - DOI - PMC - PubMed
    1. Amador‐Tejada, A. , Sharma B., and Noseworthy M. D.. 2024. Resting‐State fMRI (rsfMRI) Analysis Techniques: A Comprehensive Glossary. Retrieved from osf.io/pkz3j.
    1. Arthurs, O. J. , and Boniface S.. 2002. “How Well Do We Understand the Neural Origins of the fMRI BOLD Signal?” Trends in Neurosciences 25, no. 1: 27–31. 10.1016/s0166-2236(00)01995-0. - DOI - PubMed
    1. Bassett, D. S. , and Bullmore E.. 2006. “Small‐World Brain Networks.” Neuroscientist 12, no. 6: 512–523. 10.1177/1073858406293182. - DOI - PubMed
    1. Beckmann, C. F. , DeLuca M., Devlin J. T., and Smith S. M.. 2005. “Investigations Into Resting‐State Connectivity Using Independent Component Analysis.” Philosophical Transactions of the Royal Society B: Biological Sciences 360, no. 1457: 1001–1013. 10.1098/rstb.2005.1634. - DOI - PMC - PubMed