. 2025 Oct 23;16(1):9370.
doi: 10.1038/s41467-025-64407-w.

Bioenergetic reprogramming of macrophages reduces drug tolerance in Mycobacterium tuberculosis

Affiliations

Bioenergetic reprogramming of macrophages reduces drug tolerance in Mycobacterium tuberculosis

Vikas Yadav et al. Nat Commun. .

Abstract

Effective clearance of Mycobacterium tuberculosis (Mtb) requires targeting drug-tolerant populations within host macrophages. Here, we show that macrophage metabolic states govern redox heterogeneity and drug response in intracellular Mtb. Using a redox-sensitive fluorescent reporter (Mrx1-roGFP2), flow cytometry, and transcriptomics, we found that macrophages with high oxidative phosphorylation (OXPHOS) and low glycolysis harbor reductive, drug-tolerant Mtb, whereas glycolytically active macrophages generate mitochondrial ROS via reverse electron transport, imposing oxidative stress on Mtb and enhancing drug efficacy. Computational and genetic analyses identified NRF2 as a key regulator linking host metabolism to bacterial redox state and drug tolerance. Pharmacological reprogramming of macrophages with the FDA-approved drug meclizine (MEC) shifted metabolism towards glycolysis, suppressed redox heterogeneity, and reduced Mtb drug tolerance in macrophages and mice. MEC exhibited no adverse interactions with frontline anti-TB drugs. These findings demonstrate the therapeutic potential of host metabolic reprogramming to overcome Mtb drug tolerance.


Conflict of interest statement

Competing interests: The authors declare no competing interests.

Figures
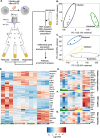
Fig. 1
Fig. 1. Transcriptomic profiling of macrophages harboring redox diverse Mtb.
A Schematic showing flow sorting–coupled RNA seq of macrophage subpopulations: uninfected (green), bystanders (gray), macrophages harboring EMSH-oxidized (yellow, here on labeled as ‘oxidized’) or EMSH-reduced (blue, here on labeled as ‘reduced’) Mtb; B Principal component analysis (PCA) plot comparing infected and uninfected macrophages; C PCA plot showing the subpopulations within the infected macrophages: ‘bystanders’, ‘oxidized’, ‘reduced’; D Heat map of genes differentially expressed between the subpopulations; genes clustered according to their involvement in pathways: E Oxidative phosphorylation; F NRF2 regulon; G Hippo signaling. Heatmaps are generated from three independent experiments with base mean >10, FDR < 0.1, and log2FC > 0.6. Figure 1A: Created in BioRender. Yadav, V. (2025) https://BioRender.com/6x5yph4. Source data are provided as a Source Data file.
Fig. 2
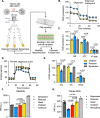
Fig. 2. Bioenergetically heterogeneous BMDMs harbor redox-diverse bacteria.
A Workflow of the flow-sorting coupled Seahorse Extracellular Flux analysis; B, C A modified mitostress test was performed to calculate mitochondrial parameters. BR- basal respiration, ATP- ATP production, H + -leak- proton leak; D, E ECAR test was performed to assess the parameters associated with glycolysis in the three sorted BMDM subpopulations. Gly- glycolysis, GC- glycolytic capacity, NGA- non-glycolytic acidification; F Mitochondrial ROS in Mtb-roGFP2 infected BMDMs. Antimycin A used as the positive control; G Cellular ROS measured in Mtb-roGFP2 infected BMDMs, 100 µM menadione used as the control. MFI- median fluorescence intensity, a.u.-arbitrary units. Data are expressed as mean ± S.D., representative of three independent experiments. p-value determined using a Student’s two-tailed t-test with Welch’s correction for comparison between two groups or one-way ANOVA with Dunnett’s T3 test for multiple comparisons. Figure 2A: Created in BioRender. Yadav, V. (2025) https://BioRender.com/y42m819. Source data are provided as a Source Data file.
Fig. 3
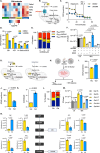
Fig. 3. NRF2 knockdown diminishes EMSH-reduced fraction and reverses antibiotic tolerance in macrophages.
A z-normalized RNA-Seq data of uninfected, bystanders, oxidized, and reduced populations, where genes are clustered by expression levels. Only those genes are represented that satisfy two of the following criteria: belong to the Nrf2 pathway (red) and bear the NRF2 binding motif in the promoter region (green) or have an NRF2 ChIP-seq (Chromatin immunoprecipitation followed by sequencing) peak detected near the promoter region (blue). Genes in black represent those that are significantly upregulated in the reduced subpopulation in comparison to the oxidized subpopulation (no gene upregulated in the oxidized subpopulation was detected amongst the above genes); B Mitochondrial ROS in BMDMs transfected either with scrambled siRNA (siSCR, yellow) or siRNA targeted against Nrf2 (siNRF2, blue) at 24 h p.i. MFI- median fluorescence intensity, a.u.-arbitrary units; C, D Modified mitostress test of siSCR- or siNRF2-BMDMs at 24 h p.i. infected with Mtb H37Rv at a multiplicity of infection (moi) of 2. BR- basal respiration, ATP- ATP production, H + -leak- proton leak, nmOCR- non-mitochondrial respiration; E Redox profile of Mtb-roGFP2 infected BMDMs transfected either with scrambled siRNA (siSCR) or siRNA against Nrf2 (siNRF2) at 24 h p.i; F Bar plot showing the colony forming units (CFUs) of Mtb in siSCR and siNRF2 BMDMs, treated with 3X MIC of INH (0.375 µg/ml) for 48 h. INH treatment was initiated at 24 h p.i.; G Mitochondrial ROS assessed in infected BMDMs upon treatment with different concentrations of SFN at the indicated concentrations at 24 h p.i.; H Glycolytic function test showing the ECAR upon treatment with 0.05% DMSO (vehicle control, labeled “DMSO”) or 5 µM SFN at 24 h p.i.; I Percentage distribution of redox-diverse fractions of Mtb-roGFP2 in BMDMs treated with the indicated concentrations of SFN at 24 h p.i.; J Antibiotic tolerance of intracellular Mtb assessed by CFUs upon treatment with vehicle or 5 µM SFN and 3X MIC of INH (0.375 µg/ml) for 48 h. Data are expressed as mean ± S.D. of three independent experiments. p-value determined using a Student’s two-tailed t-test with Welch’s correction for comparison between two groups or one-way ANOVA with Dunnett’s T3 test for multiple comparisons. Source data are provided as a Source Data file.
Fig. 4
Fig. 4. Macrophage metabolism affects redox physiology and antibiotic tolerance of intracellular Mtb.
A Heat map showing expression of different subunits of the pyruvate dehydrogenase complex in the macrophage subpopulations: uninfected (green), bystanders (gray), macrophages harboring EMSH-oxidized (yellow) or EMSH-reduced (blue) Mtb; B Mechanism of action of UK5099, a mitochondrial pyruvate carrier (MPC) inhibitor; C, D. Modified mitostress test of Mtb-infected BMDMs upon treatment with 0.05% DMSO (vehicle control, labeled “DMSO”) or 10 µM UK5099 at 24 h p.i. BR- basal respiration, ATP- ATP production, H + -leak- proton leak, nmOCR- non-mitochondrial respiration; E Redox profile of intracellular Mtb in BMDMs 24 h p.i. treated with indicated concentrations of UK5099; F Antibiotic tolerance to 3X MIC of INH (MIC: 0.125 µg/ml) or MOXI(MIC: 0.25 µg/ml) with or without 10 µM UK5099; G Schematic representation of cellular metabolic pathways in the presence of 10 mM glucose or 10 mM galactose as sole sugar sources; H Experimental design to determine the effect of glucose (Glu) and galactose (Gal) on the redox profile and antibiotic tolerance of intracellular Mtb; I–K Extracellular flux analysis of Mtb-infected BMDMs at 24 h p.i. to measure basal respiration (BR) (I), glycolysis (J), and a ratio of OCR (BR) to ECAR (glycolysis) (K); L Redox profile of the intracellular Mtb in the presence of 10 mM Glu or 10 mM Gal as sole sugars at 24 h p.i.; M Antibiotic tolerance to 3X MIC of INH in Glu- or Gal-containing medium; N Intracellular abundance of glycolytic intermediates in Mtb-infected BMDMs growing in medium containing either 10 mM Glu or Gal at 24 h p.i. Data are expressed as mean ± S.D. of three independent experiments. p-value determined using a Student’s two-tailed t-test with Welch’s correction for comparison between two groups or one-way ANOVA with Dunnett’s T3 test for multiple comparisons. Figure 4B, G, H: Created in BioRender. Yadav, V. (2025) https://BioRender.com/gi9w8lj; https://BioRender.com/n53i529; https://BioRender.com/f70x563. Source data are provided as a Source Data file.
Fig. 5
Fig. 5. MEC-mediated glycolytic activation diminishes antibiotic tolerance in infected macrophages.
A Bar plot showing the mitochondrial respiratory parameters determined by the modified mitostress test at 24 h p.i. upon treatment with 20 µM MEC or 0.2% DMSO (vehicle control, labeled “DMSO”). BR- basal respiration, ATP- ATP production, H + -leak- proton leak; B Glycolytic stress test to assess the glycolytic levels in infected macrophages 24 h p.i. upon treatment with 20 µM MEC or vehicle. Gly- glycolysis, GC- glycolytic capacity, NGA- non-glycolytic acidification; C Mitochondrial ROS measured upon treatment with 20 µM MEC at 24 h p.i.; D Mitochondrial membrane polarization measured by JC-1 dye at 24 h p.i., 50 µM carbonyl cyanide-p-trifluoromethoxyphenylhydrazone (FCCP) treatment used as positive control; UI: uninfected macrophages; E Representative pseudocoloured 3D views of uninfected and mCherry expressing Mtb-infected BMDMs at 24 h p.i., with and without exposure to 20 μM MEC. Mitochondria (amber), Mtb H37Rv (green), and the nucleus (purple) are shown as surfaces. Plots show the surface area (µm2) and volume (µm3) of mitochondria in uninfected and infected BMDMs (n > 500 from 6-8 cells per condition). Data are median with interquartile range. p-values calculated using a one-way ANOVA with Dunn’s multiple comparisons test. UI: uninfected BMDMs, Inf: infected BMDMs; F, G RNA-seq of BMDMs infected with Mtb and treated with 20 µM MEC at 24 h p.i. F OXPHOS gene expression between vehicle-treated and MEC-treated BMDMs; and (G) net enrichment score (NES) calculated by gene set enrichment analysis (GSEA) for the DEGs between MEC- and vehicle-treated infected macrophages; H Redox profile of the intracellular Mtb in the presence of indicated concentrations of MEC at 24 h p.i.; I Antibiotic tolerance in Mtb-infected BMDMs treated with 20 µM MEC and 0.5 mM 2-DG in the presence of 3X MIC of INH (0.375 µg/ml) or MOXI (0.75 µg/ml). Data are expressed as mean ± S.D. of three biological replicates done in triplicate. p-value determined using a Student’s two-tailed t-test with Welch’s correction for comparison between two groups or one-way ANOVA with Dunnett’s T3 test for multiple comparisons. Source data are provided as a Source Data file.
Fig. 6
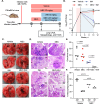
Fig. 6. MEC reduces antibiotic tolerance in vivo.
A Strategy for investigating the efficacy of MEC at reducing tolerance against INH in C3HeB/FeJ mice; B Bacterial CFUs counted from lungs at the indicated time-points. Number of animals in each group for the 10 weeks p.i. timepoint are vehicle (n = 9), MEC (n = 10), INH (n = 7), and MEC + INH (n = 10). Data are expressed as mean ± S.D., and the p-value was determined by the two-tailed Mann-Whitney test; C Gross pathology of lungs of Mtb-infected mice at 10 weeks p.i across experimental groups; D Hematoxylin and eosin–stained lung sections (after 6 weeks of treatment) from mice infected with Mtb for all experimental groups. Pathology sections show granuloma (G), alveolar space (AS), collapsed parenchyma (CP), and necrotic area (N). All images were taken at 10X magnification; E Granuloma score was calculated from the histopathological lung sections from 5 mice in each group, F Proportions of AM and IM populations in the lungs of animals treated either with vehicle control or with MEC for 3 mice in each group. For (E) and (F), data are expressed as mean ± S.D., and the p-value is determined using one-way ANOVA with Dunnett’s T3 test for multiple comparisons. Source data are provided as a Source Data file.
Fig. 7
Fig. 7. MEC exhibits no adverse interaction with anti-TB drugs.
A Three groups of treatment in BALB/c mice used in the pharmacokinetic study: MEC alone, front-line anti-TB combination therapy (HREZ), and combination (MEC + HREZ); B–F Line plots indicate pharmacokinetic profiles of MEC and individual drugs of the anti-TB therapy regimen, analyzed individually and in the presence of each other in the plasma of animals. Differences were non-significant by the two-tailed Mann-Whitney test (p > 0.05). G Ratios of Cmax and AUClast of individual drugs or a combination with MEC to analyze drug-drug interactions. Doses used are the following: MEC, 25 mg/kg body weight, ip; H, 25 mg/kg body weight, per os (po); R, 10 mg/kg body weight, po; E, 200 mg/kg body weight, po; Z, 150 mg/kg body weight, orally; BDL, below the detection limit. All data are means ± S.D. of concentrations at each time point of samples in triplicate (n = 3 animals per group), H Lung deposition of MEC alone and combined with anti-TB drugs at 6 h and 24 h post-ip  administration. Source data are provided as a Source Data file.

References

    1. Lenaerts, A., Barry, C. E. 3rd & Dartois, V. Heterogeneity in tuberculosis pathology, microenvironments and therapeutic responses. Immunol. Rev.264, 288–307 (2015). - PMC - PubMed
    1. Mishra, R., Yadav, V., Guha, M. & Singh, A. Heterogeneous host-pathogen encounters coordinate antibiotic resilience in mycobacterium tuberculosis. Trends Microbiol29, 606–620 (2021). - PMC - PubMed
    1. Cadena, A. M., Fortune, S. M. & Flynn, J. L. Heterogeneity in tuberculosis. Nat. Rev. Immunol.17, 691–702 (2017). - PMC - PubMed
    1. Liu, Y. et al. Immune activation of the host cell induces drug tolerance in Mycobacterium tuberculosis both in vitro and in vivo. J. Exp. Med213, 809–825 (2016). - PMC - PubMed
    1. Huang, L., Nazarova, E. V., Tan, S., Liu, Y. & Russell, D. G. Growth of Mycobacterium tuberculosis in vivo segregates with host macrophage metabolism and ontogeny. J. Exp. Med215, 1135–1152 (2018). - PMC - PubMed

MeSH terms

LinkOut - more resources