. 2025 Oct 23;16(1):9387.
doi: 10.1038/s41467-025-64447-2.

FAP+ fibroblasts orchestrate tumor microenvironment remodeling in renal cell carcinoma with tumor thrombus

Affiliations

FAP+ fibroblasts orchestrate tumor microenvironment remodeling in renal cell carcinoma with tumor thrombus

Jiacheng Ma et al. Nat Commun. .

Abstract

Tumor thrombus (TT) worsens prognosis and complicates surgery in renal cell carcinoma (RCC), yet its formation mechanisms remain unclear. Here, we perform integrative single-cell and spatial transcriptomic analyses on 71 tissues and 48 sections from RCC patients with or without TT. The cellular and spatial atlas reveals distinct TT-associated tumor microenvironment remodeling characterized by the enrichment of FAP+ fibroblasts. These FAP+ fibroblasts are spatially contiguous to aggressive cancer cells and promote their malignant phenotypes in vitro. Their abundance inversely correlates with functional NK cells, suggesting roles in tumor invasion and immune evasion. Furthermore, single-cell multiomics analysis identifies tumor pericytes as a source of FAP+ fibroblasts and delineates transcription factor dynamics underlying pericyte-fibroblast transition. Finally, high levels of FAP+ fibroblasts are associated with poor prognosis and predict a weaker response to anti-VEGF-based therapy. In conclusion, our study highlights FAP+ fibroblasts as drivers of aggressive RCC with TT, suggesting potential therapeutic targets.


Conflict of interest statement

Competing interests: The authors declare no competing interests.

Figures
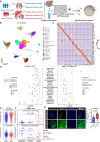
Fig. 1
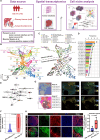
Fig. 1. scRNA-seq analysis revealed the significant TME remodeling in RCC with TT.
A Schematic diagram of sampling strategy and scRNA-seq analysis workflow for our discovery dataset. B UMAP plot of 163,762 high-quality single cells from 56 freshly collected tissue samples (n = 22 AT, 22 PT, 12 TT samples) collected from 22 RCC patients in our discovery dataset, colored by cell type annotations. Cells were processed using the BD Rhapsody platform following mechanical and enzymatic dissociation, and filtered based on standard quality control criteria (mitochondrial content >20%, gene number <200 or >5000, UMI count <1000 or >20000; see Methods for details). Major cell types were defined based on canonical markers expression following graph-based clustering. C Heatmap showing representative marker genes in each of cell types identified in the discovery scRNA-seq dataset. D Systematic evaluation of alterations in cell-type proportion based on the comparison strategy shown in Supplementary Fig. 2A. Left: Intra-patient comparison of cell-type proportions among AT (n = 14), PT (n = 14), and TT (n = 12) samples from RCC patients with TT (the two-sided paired t-test). Right: Inter-patient comparison of cell-type proportions in the same tissue region (AT or PT) between RCC patients with and without TT (n = 14 and 8, respectively; the two-sided unpaired t-test). The dashed line indicates a false discovery rate (FDR) threshold of 0.2. Full results are provided in Supplementary Data 3. E ssGSEA analysis showing signature scores of fibroblasts (upper) and NK cells (lower) in PTs from patients with (n = 99) and without (n = 431) TT in TCGA-KIRC dataset. Patients were stratified by TT status manually annotated based on the TCGA pathology reports (Supplementary Data 4). P-values were determined using the two-sided Wilcoxon rank-sum test. Box plots display median, upper and lower quartiles, with whiskers indicating maximum and minimum data points within 1.5 × interquartile range. F Box plots showing the proportions of fibroblasts (upper) and NK cells (lower) in primary tumors (PTs) from patients with and without TT in the discovery dataset (n = 14 and 8, respectively) and the public scRNA-seq dataset (n = 19, without TT only) from Yu et al.. As Yu et al.‘s dataset does not include patients with TT, three groups were established: PTs_with_TT (our data), PTs_without_TT (our data) and PTs_without_TT (Yu et al.). P-values were determined using two-sided unpaired t-test to evaluate pairwise difference among the three groups. Box plots display median, upper and lower quartiles, with whiskers indicating maximum and minimum data points within 1.5 × interquartile range. G Representative immunofluorescence images (left) and quantification (right) of fibroblast abundance in tumor sections from RCC patients with (n = 8) and without (n = 8) TT. DCN (green) marks fibroblasts, and DAPI (blue) stains nuclei. Representative images from each clinical subgroup are shown to visualize fibroblast abundance at the tissue level. Fibroblast quantification was performed using QuPath-based cell annotation. This analysis serves as orthogonal validation for Fig. 1D. Scale bar = 200 µm; Scale bar inset = 50 µm. P-values were determined using the two-sided Wilcoxon rank-sum test. Box plots show the distribution of the proportion of DCN+ cells across groups. The box represents the interquartile range (IQR, 25th–75th percentile), with the horizontal line indicating the median. Whiskers denote minimum and maximum values. Source data are provided as a Source Data file.
Fig. 2
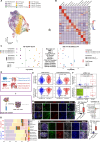
Fig. 2. Spatial characterization of renal cell carcinoma (RCC) through integrative spatial transcriptomics analysis.
A Schematic diagram of the spatial transcriptomics analysis workflow. All data were generated using the 10X Visium platform. Cell niche analysis was performed based on our spatial integration strategy to dissect the spatial organizations in RCC. For more details, see Supplementary Fig. 4A and Methods section. BC UMAP projection of spatial domains (n = 835 domains) identified across 48 spatial transcriptomics samples. Each point represents a spatial domain defined via stLearn. In (B), spatial domains are colored by their assigned cell niche (CN1-CN23). One representative pie chart per CN indicates dominant cell types (>8%). In (C), each spatial domain is displayed as a pie chart showing its major cell-type composition (>8%). Pie chart colors correspond to the cell types shown in the legend (C). A complementary UMAP embedding colored by data source, sample type, and section identity is provided in Supplementary Fig. 5A to confirm effective batch correction. Detailed results are provided in Supplementary Data 5, summarizing dominant cell types and putative functions of each cell niche. D Bar plot showing the frequency of occurrence (x-axis) of each cell niche (y-axis) across 48 tumor sections. Colors in the bar and pie plots correspond to the cell niches in (B) and cell types in (C), respectively. E Network graph showing spatial associations of dominant cell types across all 23 CNs, delineating how distinct cell populations are spatially organized within the TME. Each node represents a dominant cell type, and an edge connects two cell types that were simultaneously observed within at least one CN. F Boxplot comparing the area of CN15 in PT samples from RCC patients with (n = 8) and without (n = 8) TT. P-values were determined using the two-sided unpaired t-test. Box plots display median, upper and lower quartiles, with whiskers indicating maximum and minimum data points within 1.5 × interquartile range. G Spatial mapping of cell niches (left) and dominant cell types of CN15 (right) in tumor thrombus (P33, n = 4,258 spots) and primary tumor (P30, n = 4,287 spots) sections from two RCC patients with TT. Arrows indicate the location of CN15. This panel provides a visual complement to Fig. 2F by depicting the spatial localization and cellular composition of CN15 at the tissue level. Data are representative of n  =  18 spatial transcriptomic slides. H Representative multiplex immunofluorescence images (left) and quantitative analysis (right) of CN15-like regions—defined by the spatial adjacency of fibroblasts (DCN, green) and EMT-like cancer cells (PLOD2, red)—in tumor sections from RCC patients without (n = 5) and with (n = 5) TT. DCN+ and PLOD2+ cells were annotated using QuPath, and their interface regions were manually delineated and quantified using Fiji software. The cumulative area of each interface region was then normalized to the total area of the corresponding tumor section. Box plots show the distribution of the interface area (% tissue area) between DCN+ cells and PLOD2+ cells across groups. The box represents the interquartile range (IQR, 25th–75th percentile), with the horizontal line indicating the median. Whiskers denote minimum and maximum values. This analysis provides spatial validation of the findings shown in Fig. 2F. Scale bar = 200 µm; Scale bar inset = 50 µm. P-values were determined using the two-sided Wilcoxon rank-sum test. Source data are provided as a Source Data file.
Fig. 3
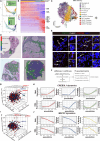
Fig. 3. Stromal remodeling during RCC tumorigenesis and TT formation.
A UMAP plot of mesenchymal cells (n = 13,965 cells) from our discovery dataset (n = 22 patients; n = 22 AT, 22 PT, and 12 TT samples), colored by mesenchymal cell subsets. For the distribution of these cells by tissue region (AT, PT and TT), clinical subgroup (with and without TT), and patient identity, see also Supplementary Fig. 6A, B. B Heatmap showing representative marker genes for each mesenchymal cell subset identified in the discovery dataset. C Systematic evaluation of alterations in the proportions of mesenchymal cell subsets in our discovery dataset, based on our comparison strategy (refer to Supplementary Fig. 2A). For more details, see the legend for Fig. 1D. Full results are provided in Supplementary Data 3. D Schematic diagram of the scRNA-seq workflow used for the validation dataset, which applied a negative selection strategy to enrich for mesenchymal and epithelial cells. E ssGSEA analysis showing the enrichment scores of FAP+ fibroblast (upper) and CYSLTR2+ fibroblast (lower) signatures—derived from our discovery dataset —in ATs (right; n = 18 and 54, respectively) and PTs (left; n = 99 and 431, respectively) from RCC patients with and without TT in the TCGA-KIRC bulk RNA-seq dataset. P-values were determined using the two-sided Wilcoxon rank-sum test. Box plots display median, upper and lower quartiles, with whiskers indicating maximum and minimum data points within 1.5 × interquartile range. F Box plots showing the proportions of FAP+ fibroblasts (upper) and CYSLTR2+ fibroblasts (lower) in PTs from patients with and without TT, based on scRNA-seq data from both our discovery dataset (n = 8 and n = 5, respectively; PT samples with <50 mesenchymal cells were excluded) and the Yu et al. dataset (n = 19, without TT only). Groups were defined as in Fig. 1F, and P-values were calculated using the two-sided unpaired t-test. Box plots display median, upper and lower quartiles, with whiskers indicating maximum and minimum data points within 1.5 × interquartile range. G Stacked bar plots showing the proportions of mesenchymal cell subsets in PTs from each patient in our validation dataset (n = 6). We highlighted FAP+ fibroblasts and CYSLTR2+ fibroblasts in this plot. Patient IDs were colored by TT status (blue: with TT; red: without TT). H Representative multiplex immunofluorescence images (left) and quantification (right) of FAP+ fibroblasts—defined as DCN+FAP+ double-positive cells—in tumor sections from RCC patients without (n = 8) and with (n = 8) TT. DCN (green) marks fibroblasts, and FAP (red) labels the specific fibroblast subset. FAP+ fibroblasts were annotated and quantified using QuPath. Box plots show the distribution of the proportion of DCN+FAP+ cells across groups. The box represents the interquartile range (IQR, 25th–75th percentile), with the horizontal line indicating the median. Whiskers denote minimum and maximum values. This analysis provides orthogonal validation for Fig. 3C. Scale bar = 200 µm. Scale bar inset = 50 µm. P-values were calculated using the two-sided Wilcoxon rank-sum test. I Violin plot showing the cell2location-inferred proportions of each mesenchymal cell subset within CN15, based on spatial mapping of 48 spatial transcriptomics samples using reference signatures estimated from our discovery dataset. J Representative multiplex immunofluorescence images (left) and quantification (right) of CN15-like regions—refined based on the spatial adjacency of FAP+ fibroblasts (DCN+FAP+, green & red) and EMT-like cancer cells (PLOD2+, white)—in tumor sections from RCC patients without (n = 5) and with (n = 5) TT. DCN+FAP+ double-positive cells and PLOD2+ cells were annotated using QuPath. Their interface regions were manually delineated and quantified using Fiji software, followed by normalization to the total area of the tumor section. Box plots show the distribution of the interface area (% tissue area) of DCN+FAP+ cells and PLOD2+ cells across groups. The box represents the interquartile range (IQR, 25th-75th percentile), with the horizontal line indicating the median. Whiskers denote minimum and maximum values. This analysis provides spatial validation for Figs. 2H and 3I. Scale bar = 200 μm; Scale bar inset = 50 μm. P-values were determined using the two-sided Wilcoxon rank-sum test. Box plots display median, upper and lower quartiles, with whiskers indicating maximum and minimum data points within 1.5 × interquartile range. Source data are provided as a Source Data file.
Fig. 4
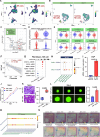
Fig. 4. Pericyte-fibroblast transition in RCC.
A Upper: Diffusion map embedding of pericyte 2 (n = 3,274 cells), CYSLTR2+ fibroblasts (n = 529 cells) and FAP+ fibroblasts (n = 503 cells) based on the gene expression profile from our discovery dataset (n = 22 patients; n = 22 AT, 22 PT, and 12 TT samples). Lower: Slingshot-inferred pseudotime on the same embedding above. B Heatmap showing the top 200 pseudotime-associated genes identified by PseudotimeDE. Representative genes associated with cell subsets (tumor pericytes, CYSLTR2+ fibroblasts and FAP+ fibroblasts) are annotated on the right. C RNA velocity of mesenchymal cells (n = 13,965 cells) in our discovery dataset (n = 22 patients; n = 22 AT, 22 PT, and 12 TT samples), highlighting the velocity flow of pericyte 2 to CYSLTR2+ fibroblasts and subsequently to FAP+ fibroblasts. D Spatial mapping of pericyte 2, CYSLTR2+ fibroblasts, FAP+ fibroblasts in 4 representative RCC sections, showing only spots where the cell2location-inferred proportion of these cells exceeds 8% (upper left, n = 243 spots; upper right, n = 1079 spots; lower left, n = 1,866 spots; lower right, n = 3861 spots). Arrows indicate regions with potential pericyte-fibroblast transitions. E Representative RNA in situ hybridization images showing CSPG4 (pericyte, green), THBS2 (FAP+ fibroblast, white), PDGFRB (mesenchymal cell, red) and DAPI (blue) in RCC sections. Arrows indicate cells co-expressing CSPG4 and THBS2, representing a transitional state between pericytes and FAP+ fibroblasts. Data shown are representative data from 4 biologically independent replicates. Similar results were observed in all replicates. F Schematic of the computational workflow used to identify key transcription factors involved in the pericyte-fibroblast transition. G Pairwise correlation analysis (Spearman) among the expression, chromatin accessibility, and regulon activity of transcription factors in Long et al. dataset (red, dataset 1; n = 1 patient, 1 PT sample, 486 cells) and Yu et al. dataset (blue, dataset 2; n = 19 patients, 19 PT samples, 2692 cells). Gene names were labeled when all three transcription factor metrics were mutually correlated (Spearman correlation coefficients > 0.1) and showed pseudotime-dependent dynamics, as determined by PseudotimeDE (the one-sided permutation test with Benjamini–Hochberg correction; adjusted p < 0.05). For CREB3L1, p-values for expression, chromatin accessibility, and regulon activity along pseudotime were 0.0032, 0.0016, and 1.1 × 10−28 in the Long et al. dataset, and 2.8 × 10−5, 4.6 × 10−5, and 1.4 × 10−23 in the Yu et al. dataset. H Gene expression (left), regulon activity (middle), and chromatin accessibility (right) of CREB3L1 over pseudotime in Long et al. dataset (upper, dataset 1; n = 1 patient, 1 PT sample, 486 cells) and Yu et al. dataset (lower, dataset 2; n = 19 patients, 19 PT samples, 2692 cells). Error bands represent 95% confidence intervals around the fitted curve. I Pairwise correlation analysis (Spearman) among the expression, regulon activity, and binding activity of transcription factors in Long et al. dataset (red, dataset 1; n = 1 patient, 1 PT sample, 486 cells) and Yu et al. dataset (blue, dataset 2; n = 19 patients, 19 PT samples, 2692 cells). Gene names were labeled when all three transcription factor metrics were mutually correlated (Spearman correlation coefficients > 0.1) and showed pseudotime-dependent dynamics, as determined by PseudotimeDE (one-sided permutation test with Benjamini–Hochberg correction; adjusted p < 0.05). For MEF2C, p-values for expression, regulon activity, and binding activity along pseudotime were 8.1 × 10−10, 3.7 × 10−24, and 3.0 × 10−41 in the Long et al. dataset, and 2.7 × 10−11, 7.5 × 10−13, and 2.1 × 10−28 in the Yu et al. dataset. J Gene expression (left), regulon activity (middle), and binding activity (right) of MEF2C over pseudotime in Long et al. dataset (upper, dataset 1; n = 1 patient, 1 PT sample, 486 cells) and Yu et al. dataset (lower, dataset 2; n = 19 patients, 19 PT samples, 2692 cells). Error bands represent 95% confidence intervals around the fitted curve. Source data are provided as a Source Data file.
Fig. 5
Fig. 5. FAP+ fibroblast promotes TT formation by regulating NK cells and EMT-like cancer cells.
A, B Density plots of UMAP embeddings of all immune cells or cycling cells in PTs from RCC patients with (n = 14) and without (n = 8) TT, based on the discovery dataset. Random downsampling was performed to maintain the same number of cells (immune cells: n = 20,123; cycling cells: n = 774) in each group. NK cells and cycling NK cells were outlined with a red dashed line to highlight changes in their abundance. C Volcano plot showing differentially expressed genes in NK cells between PTs from RCC patients with (n = 14) and without (n = 8) TT, based on the discovery dataset. P-values were obtained using the two-sided Wilcoxon rank-sum test with Bonferroni correction. D Violin and box plots showing the expression levels of CXCR4 and CX3CR1 in NK cells from PT samples of RCC patients with (n = 14) and without TT (n = 8), based on the discovery dataset. Statistical significance was determined using the two-sided Wilcoxon rank-sum test. Box plots display median, upper and lower quartiles, with whiskers indicating maximum and minimum data points within 1.5 × interquartile range. E KEGG pathway activity in NK cells from PT samples of RCC patients with (n = 14) and without (n = 8) TT, based on the discovery dataset. Pathway activity scores were calculated using AUCell at the single-cell level, and differentially activated pathways were identified using the limma package with a two-sided moderated t-test. The six pathways shown were selected from the top ten most significantly different pathways based on adjusted p-values (Benjamini–Hochberg correction). Box plots display median, upper and lower quartiles, with whiskers indicating maximum and minimum data points within 1.5 × interquartile range. The full ranked list of pathways and statistical details are provided in Supplementary Data 10. F Linear regression plot showing a significant negative correlation (two-sided one-sample t-test) between the proportions of NK cells and total fibroblasts in PT samples (n = 22, discovery dataset), based on the discovery dataset. Error bands represent 95% confidence intervals around the fitted curve. G Dot plot showing differential ligand-receptor crosstalk between fibroblasts and NK cells in PTs from RCC with (n = 14) and without (n = 8) TT, based on the discovery dataset. H Dot plot showing the cellular crosstalk (TGFB1-TGFBR1 and CXCL12-CXCR4) between NK cells and five fibroblast subsets, based on the discovery dataset (n = 22 patients; n = 22 AT, 22 PT, and 12 TT samples). CellPhoneDB was used to compute P-values using the one-sided permutation test to assess the statistical significance of ligand-receptor interactions. I qRT-PCR analysis of FAP mRNA expression in CAFs from RCC with and without TT (FAP+ CAFs from P_911 and FAP- CAFs from P_910) to determine the mRNA level of FAP. Data were presented as mean ± SD from 3 biological replicates (primary CAFs isolated from distinct tumor core regions). Statistical significance was assessed using two-sided Student’s t-test. J Cell growth ability was assessed using CCK8 assays at the specified time intervals in 786-O cell line treated with conditioned media (CM) from FAP+ and FAP- CAFs. Data were presented as mean ± SD from 3 biological replicates (primary CAFs isolated from distinct tumor core regions). Statistical analysis was performed using two-way ANOVA. K The migration ability of 786-O cell line treated with CM from different CAFs was measured using a transwell assay. Box plots show the distribution of cell counts across groups. The box represents the interquartile range (IQR, 25th–75th percentile), with the horizontal line indicating the median. Whiskers denote minimum and maximum values. Quantification was performed with n = 4 random fields. Two-sided Student’s t-test was used to assess statistical significance. Scale bar = 100 µm. L Images (left) and quantification (right) of all spheroids generated using Zsgreen-expressing 786-O cells co-cultured with FAP+ and FAP- CAFs (left). Circularity was quantified for 786-O cells (right). Spheroid circularity was quantified and normalized to spheroids without CAFs. Data were presented as mean ± SD from 3 biological replicates (primary CAFs isolated from distinct tumor core regions). Two-sided Student’s t-test. Scale bar = 300 µm. M Dot plot illustrating significant ligand-receptor interactions between FAP+ fibroblasts and cancer cell subsets (EMT-like and cycling), as inferred by CellPhoneDB, based on the discovery dataset (n = 22 patients; n = 22 AT, 22 PT, and 12 TT samples). N Spatial expression patterns of selected ligand-receptor genes (upper) and corresponding ssGSEA scores for integrin-related pathways (lower) in a representative TT sample (P33, n = 4,258 spots). Only spatial spots dominated by fibroblasts, EMT-like cancer cells, or cycling cancer cells (as inferred by cell2location) are shown. Data are representative of n  =  18 spatial transcriptomic slides. Source data are provided as a Source Data file.
Fig. 6
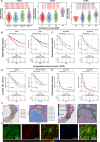
Fig. 6. FAP+ fibroblast enrichment predicts poor prognosis and anti-VEGF Resistance in RCC.
A ssGSEA score of FAP+ fibroblast signature for the indicated clinical stage (Stage I–IV; n = 269, 57, 125 and 83 patients, respectively), T stage (T1–T4; n = 275, 69, 182 and 11 patients, respectively) and pathological grading (G1–G4; n = 14, 230, 207 and 78 patients, respectively) in the TCGA-KIRC dataset. P-values were determined by the two-sided Wilcoxon rank-sum test and adjusted for multiple comparisons using the Benjamini-Hochberg method. Box plots display median, upper and lower quartiles, with whiskers indicating maximum and minimum data points within 1.5 × interquartile range. B Kaplan–Meier analysis for overall survival in TCGA-KIRC dataset based on FAP+ fibroblast (left; high, n = 241; low, n = 292) and CYSLTR2+ fibroblast (right; high, n = 199; low, n = 334) signature scores using optimal cutoff method. P-values were determined by the two-sided log-rank test. C Kaplan–Meier analysis for overall survival in the nivolumab arm (left; high, n = 132; low, n = 49) and everolimus arm (right; high, n = 63; low, n = 67) of Checkmate cohorts based on FAP+ fibroblast signature score using optimal cutoff method. P-values were determined by the two-sided log-rank test. D Kaplan–Meier analysis for progression-free survival in the sunitinib arm (left; high, n = 204; low, n = 168) and avelumab + axitinib arm (right; high, n = 73; low, n = 281) of Javelin 101 cohort based on FAP+ fibroblast signature score using optimal cutoff method. P-values were determined by the two-sided log-rank test. E Kaplan–Meier analysis for progression-free survival in the nivolumab arm (left; high, n = 38; low, n = 143) and everolimus arm (right; high, n = 73; low, n = 57) of Checkmate cohorts based on FAP+ fibroblast signature score using optimal cutoff method. P-values were determined by the two-sided log-rank test. F Left: spatial mapping of cell niches in 2 representative samples (n = 1778 and 4972 spots, respectively) to show the close proximity of fibroblast-enriched cell niches (CN6) and intra-tumoral vasculature (CN12). Right: spatial mapping of tumor EC 1 and pericyte 2, FAP+ fibroblast in representative samples, showing only spots where the cell2location-inferred proportion of these cells exceeds 8% (n = 561 and 1285 spots, respectively). Data are representative of n  =  4 spatial transcriptomic slides. G Representative images of immunofluorescence staining of DCN (fibroblast, green), CSPG4 (pericyte, red), FAP (FAP+ fibroblast, yellow) and DAPI (blue) on a RCC section. Data shown are representative of three biologically independent replicates. Similar results were observed in all replicates.

References

    1. Siegel, R. L., Giaquinto, A. N. & Jemal, A. Cancer statistics, 2024. CA Cancer J. Clin.74, 12–49 (2024). - PubMed
    1. Hsieh, J. J. et al. Renal cell carcinoma. Nat. Rev. Dis. Prim.3, 17009 (2017). - PMC - PubMed
    1. Lardas, M. et al. Systematic review of surgical management of nonmetastatic renal cell carcinoma with vena caval thrombus. Eur. Urol.70, 265–280 (2016). - PubMed
    1. Quencer, K. B., Friedman, T., Sheth, R. & Oklu, R. Tumor thrombus: incidence, imaging, prognosis and treatment. Cardiovasc Diagn. Ther.7, S165–S177 (2017). - PMC - PubMed
    1. Martinez-Salamanca, J. I. et al. Prognostic impact of the 2009 UICC/AJCC TNM staging system for renal cell carcinoma with venous extension. Eur. Urol.59, 120–127 (2011). - PubMed

MeSH terms