. 2025 Oct 23;16(1):9381.
doi: 10.1038/s41467-025-64324-y.

A US case-control study to estimate infant group B streptococcal disease serological thresholds of risk-reduction

Affiliations

A US case-control study to estimate infant group B streptococcal disease serological thresholds of risk-reduction

Julia C Rhodes et al. Nat Commun. .

Abstract

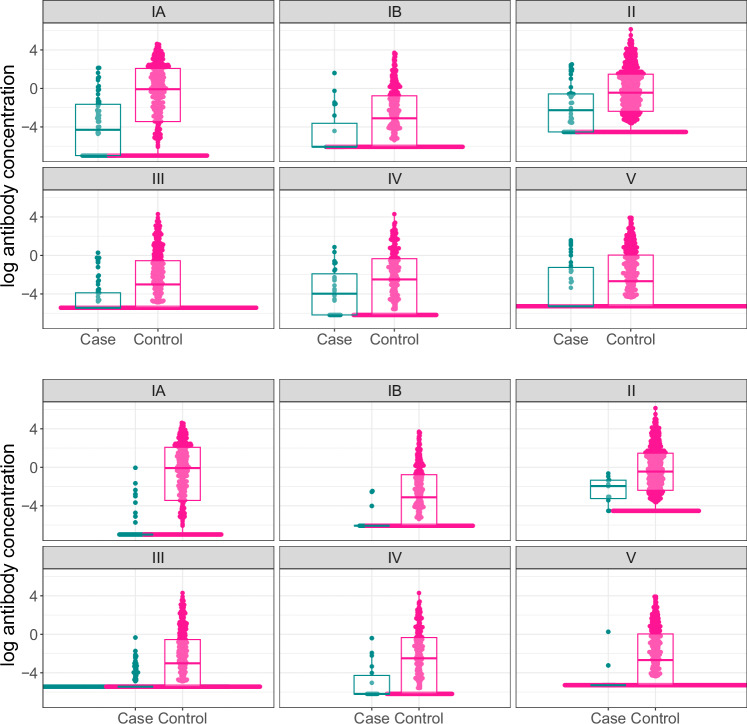
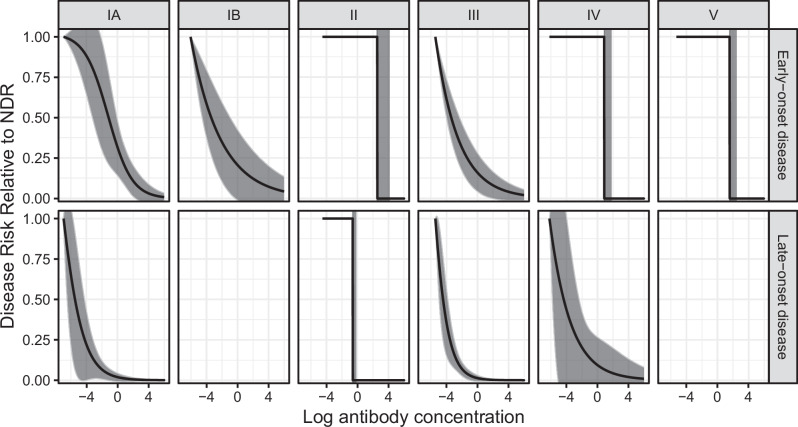
Maternal vaccines to prevent infant Group B Streptococcus (GBS) disease have progressed through phase II development and may be licensed based on immunologic endpoints, which have yet to be approved by regulatory authorities. Here we present a multistate case control study to characterize the relationship between serotype-specific anti-capsular polysaccharide (CPS) immunoglobulin G concentrations near birth and infant GBS disease risk reduction. Antibody concentration distributions are significantly lower for cases (n = 643) than controls (n = 2801) and serologic thresholds varied by serotype and age at onset, with 80% serotype-specific protective thresholds ranging from 0.52 to 2.49 mcg/mL for early-onset disease (EOD; <7 days old) and 0.02 to 0.14 mcg/mL for late-onset disease (LOD; 7-89 days old). Our study provides the most robust data to date that protection thresholds vary by serotype and are notably lower for LOD than EOD, thereby informing potential serological endpoints for phase III trials evaluating CPS-based maternal GBS vaccine candidates.


Conflict of interest statement

Competing interests: Dr. Harrison has served on scientific advisory boards and/or given lectures for Sanofi Pasteur, Pfizer, and GSK, and has served on a data and safety monitoring board for Merck. He receives no compensation other than reimbursement for any travel expenses. The remaining authors declare no competing interests.

Figures

Fig. 1
Fig. 1. Study population enrollment flow diagram.
Flow chart showing enrollment process for cases and controls. Final sample sizes for curve and protective threshold generation, disaggregated by early-onset disease and late-onset disease for each serotype, are shown at the bottom. *Cases and controls were initially enrolled only after individual-level consent. Subsequent to approval for a waiver of individual-level consent, cases and controls were enrolled as de-identified samples. †Time periods for the inclusion of de-identified samples differed by site, depending on site-specific blood spot retention policies - CA 2015−2022; GA 2018–2022; MD 2013–2022; NY 2010–2022. ‡Sites reported that cases were not included because of blood spot unavailability; however, sites were not permitted to disclose individual-level reasons for excluding ABCs cases in accordance with the study de-identification strategy. Most of the excluded cases (178/239) came from one site with a short blood spot retention period, and spots were sometimes discarded prior to collection for study purposes. **Includes n = 588 GBS colonized women who did not respond to a single mailer regarding potential study participation per site ethics board restrictions on enrollment attempts. ***Consented enrollment was used for 61/643 (9.4%) of cases and 727/2801 (26%) of controls. Control serotype could not be determined until after enrollment and processing of the maternal GBS screening specimens at CDC. As a result, the number of controls per case ranges from 1.5 for serotype III to 13.1 for serotype II due to differences in the serotype distribution of GBS isolates from infant cases vs the serotype distribution of specimens from GBS colonized pregnant women. LTFU lost to follow-up, CALM covariate-adjusted logit model.
Fig. 2
Fig. 2. Log anti-capsular polysaccharide IgG antibody concentrations by case and control status.
Individual log anti-capsular polysaccharide IgG antibody concentrations (mcg/mL) (points) and distributions (box plots) for cases and controls are shown for each serotype (panels) for early-onset disease (EOD) (top panel) and late-onset disease (LOD) (bottom panel). The points indicate individual samples; the bounds of the box from the boxplots indicate the 25th and 75th percentiles, and the line shows the median (50th percentile) value. EOD: % above the lower limit of quantification for cases: IA—55% (34/62) for cases and 82% (390/473) for controls, IB—30% (7/23) for cases and 67% (234/348) for controls, II—69% (31/45) for cases and 87% (614/706) for controls, III—34% (21/61) for cases and 63% (279/443 for controls, IV—63% (17/27) for cases and 74% (201/271) for controls, V—46% (16/35) for cases and 63% (329/523) for controls. LOD: % above the lower limit of quantification for cases: IA—20% (9/45) for cases and 82% (390/473) for controls, IB—10% (3/31) for cases and 67% (234/348) for controls, II—82% (9/11) for cases and 87% (614/706) for controls, III—14% (32/230) for cases and 63% (278/443 for controls, IV—33% (6/18) for cases and 74% (201/271) for controls, V—13% (2/16) for cases and 63% (329/523) for controls) (See Supplementary table 2 for more details).
Fig. 3
Fig. 3. Risk curves for anti-capsular polysaccharide IgG antibody concentrations and 95% confidence intervals.
Risk curves were generated using the covariate-adjusted logit model (CALM), adjusted for gestational age, intraamniotic infection, and study site, and are shown for early-onset disease (EOD) (top row) and late-onset disease (LOD) (bottom row) by serotype (columns). Disease risk is relative to the null disease risk (NDR), defined as the risk among those with antibody concentrations below the lower limit of quantification, and scaled to 1. Curves show the maximum likelihood estimate; 95% confidence intervals (gray) are generated using the same maximum likelihood approach, except for step functions (serotype IV and V EOD and serotype II EOD and LOD), which use bounds from Donovan risk thresholds. Note: curves not generated for serotype IB and V LOD (< 5 cases above the lower limit of quantification).
Fig. 4
Fig. 4. Serotype-specific anti-capsular polysaccharide IgG protective thresholds (mcg/mL) and 95% confidence intervals for early-onset disease and late-onset disease.
0.75, 0.80, and 0.90 protective thresholds (points) and 95% confidence intervals (lines) for each serotype (columns) for early-onset disease (EOD) (top row) and late-onset disease (LOD) (bottom row) derived from the risk curves generated with the covariate-adjusted logit model (CALM). Points show the maximum likelihood estimate. Lines indicate 95% confidence intervals, arrows indicate thresholds and/or upper bound beyond x axis. For step functions (serotype II, IV, and V EOD and serotype II LOD) and for those not meeting sample size criteria (serotype IB and V LOD), zero risk thresholds and bounds are used. Threshold estimates for those not meeting sample size criteria (serotype IB and V LOD) have open circles, as opposed to filled in.
Fig. 5
Fig. 5. Risk curves for anti-capsular polysaccharide IgG antibody concentrations from sensitivity analyses for timing of blood spot collection and duration of blood spot storage.
Colored lines show the following sensitivity analyses: timing of blood spot collection relative to disease onset (top panel): “Blood spot timing” curves (yellow) were generated using the CALM method after exclusion of n = 27 cases (23 EOD and 4 LOD) with samples collected more than 3 days post disease onset. Duration of blood spot storage (bottom panel): “Pre 2013” curves (light blue) were generated using the CALM method after exclusion of n = 31 case blood spot samples collected before 2013—(see supplementary information). Black dotted risk curves for the primary analysis were generated using the covariate-adjusted logit model (CALM), adjusted for gestational age, intraamniotic infection, and study site, and are shown for early-onset disease (EOD) (top row) and late-onset disease (LOD) (bottom row) by serotype (columns). Disease risk is relative to the null disease risk (NDR), defined as the risk among those with antibody concentrations below the lower limit of quantification, and scaled to 1. Curves show the maximum likelihood estimate; 95% confidence intervals (gray) are generated using the same maximum likelihood approach, except for step functions (serotype IV and V EOD and serotype II EOD and LOD), which use bounds from Donovan risk thresholds. Note: curves not generated for late-onset disease for serotypes IB and V (< 5 cases above the lower limit of quantification).
Fig. 6
Fig. 6. Risk curves for anti-capsular polysaccharide IgG antibody concentrations from sensitivity analyses for timing of antenatal screening, IAP, and alternate LOD control groups.
Colored lines show the following sensitivity analyses: Timing of antenatal screening (top panel): “Screening” curves (purple) were generated using the CALM method after exclusion of n = 165 controls screened more than five weeks prior to delivery. Intrapartum antibiotic prophylaxis (IAP) (middle panel): “Below the LLOQ” curves (blue) were generated after a small number of randomly selected controls who received 4 or more hours of IAP and had IgG concentrations below the LLOQ were treated as counterfactual cases (i.e., reclassified as cases for analytic purposes). “Clinical risk factors” curves (pink) were generated after a small number of randomly selected controls who received 4 or more hours of IAP and had clinical risk factors highly associated with EOD were treated as counterfactual cases. “Random” curves (purple) were generated after a small number of randomly selected controls who received 4 or more hours of IAP were treated as counterfactual cases. A maximum of five controls for each serotype were treated as counterfactual cases, with the exact number determined by applying the rate of cases among colonized women in the absence of IAP: 11 per 1000 live births. All curves were generated using the CALM method and repeated twice to allow for variability in the random selections. Alternate LOD control group (bottom panel): “Sample 1” (green) and “Sample 2” (blue) curves were generated using an alternate control group designed to reflect the epidemiology of LOD—see methods section. Black dotted risk curves for the primary analysis were generated using the covariate-adjusted logit model (CALM), adjusted for gestational age, intraamniotic infection, and study site, and are shown for early-onset disease (EOD) (top row) and late-onset disease (LOD) (bottom row) by serotype (columns). Disease risk is relative to the null disease risk (NDR), defined as the risk among those with antibody concentrations below the lower limit of quantification, and scaled to 1. Curves show the maximum likelihood estimate; 95% confidence intervals (gray) are generated using the same maximum likelihood approach, except for step functions (serotype IV and V EOD and serotype II EOD and LOD), which use bounds from Donovan risk thresholds. Note: curves not generated for late-onset disease for serotypes IB and V < 5 cases above the lower limit of quantification).
Fig. 7
Fig. 7. Risk curves for anti-capsular polysaccharide IgG antibody concentrations from sensitivity analyses for missing data, curve shape, and gestational age.
Colored lines show the following sensitivity analyses: Exclusions due to missing data (top panel): “Scaled logit model” curves (green) were generated using scaled logit models and include all observations (n = 268 early-onset disease cases; n = 375 late-onset cases; n = 2801 controls). Curve generation method (middle panel): “Isotonic” curves (red) were generated using isotonic regression, a non-parametric approach that does not impose curve shape—see methods section. Gestational age (bottom panel): “34 weeks+” (blue) curves were generated after restriction to cases and controls with gestational age of 34 weeks or greater. Black dotted risk curves for the primary analysis were generated using the covariate-adjusted logit model (CALM), adjusted for gestational age, intraamniotic infection, and study site, and are shown for early-onset disease (EOD) (top row) and late-onset disease (LOD) (bottom row) by serotype (columns). Disease risk is relative to the null disease risk (NDR), defined as the risk among those with antibody concentrations below the lower limit of quantification, and scaled to 1. Curves show the maximum likelihood estimate; 95% confidence intervals (gray) are generated using the same maximum likelihood approach, except for step functions (serotype IV and V EOD and serotype II EOD and LOD), which use bounds from Donovan risk thresholds. Note: curves not generated for late-onset disease for serotypes IB and V (< 5 cases above the lower limit of quantification).

References

    1. Rick, A.-M. & Beigi, R. Maternal immunizations: past, present, and future. Clin. Obstet. Gynecol.67, 605–619 (2024). - PubMed
    1. Fleischmann-Struzek, C. et al. The global burden of paediatric and neonatal sepsis: a systematic review. Lancet Respir. Med.6, 223–230 (2018). - PubMed
    1. World Health Organization. Newborn infections, https://www.who.int/teams/maternal-newborn-child-adolescent-health-and-a... (2025).
    1. Gonçalves, B. P. et al. Group B streptococcus infection during pregnancy and infancy: estimates of regional and global burden. Lancet Glob. Health10, e807–e819 (2022). - PMC - PubMed
    1. Hasperhoven, G., Al-Nasiry, S., Bekker, V., Villamor, E. & Kramer, B. Universal screening versus risk-based protocols for antibiotic prophylaxis during childbirth to prevent early-onset group B streptococcal disease: a systematic review and meta-analysis. BJOG: Int. J. Obstet. Gynaecol.127, 680–691 (2020). - PMC - PubMed

MeSH terms

LinkOut - more resources