. 2025 Nov;28(11):2366-2379.
doi: 10.1038/s41593-025-02067-1. Epub 2025 Oct 23.

A glial circadian gene expression atlas reveals cell-type and disease-specific reprogramming in response to amyloid pathology or aging

Affiliations

A glial circadian gene expression atlas reveals cell-type and disease-specific reprogramming in response to amyloid pathology or aging

Patrick W Sheehan et al. Nat Neurosci. 2025 Nov.

Abstract

While circadian rhythm disruption may promote neurodegenerative disease, the impact of aging and neurodegenerative pathology on circadian gene expression patterns in different brain cell types remains unknown. Here we used a translating ribosome affinity purification to identify the circadian translatomes of astrocytes, microglia and bulk tissue in healthy mouse cortex and in the settings of amyloid-β plaque pathology or aging. We show that glial circadian translatomes are highly cell-type-specific and exhibit profound, context-dependent reprogramming in response to amyloid pathology or aging. Transcripts involved in glial reactivity, immunometabolism and proteostasis, as well as nearly half of all Alzheimer's disease risk genes, displayed circadian oscillations, many of which were altered by pathology. Microglial oxidative stress and amyloid phagocytosis showed temporal variation in gene expression and function. Thus, circadian rhythms in gene expression are cell-dependent and context dependent, and provide important insights into glial function in health, Alzheimer's disease and aging.


Conflict of interest statement

Competing interests: The authors declare no competing interests.

Figures

Fig. 1
Fig. 1. Analysis of circadian rhythms in astrocytes and microglia using TRAP/RiboTag.
a, Schematic showing the steps in TRAP/RiboTag-RNA-seq. b, Listing of the mouse lines used and schematic of the lighting paradigm and mouse collection schedule. c,d, Fold enrichment of cell-type-specific gene expression (TRAP/Pre-IP) from AstroTRAP mice (c) and mgRiboTag mice (d). e, Representative image of amyloid plaque burden in 6-month APP/PS1-21 mice, as assessed by anti-Aβ antibody HJ3.4b. Scale bar, 0.5 mm. f,g, Fold enrichment of cell-type-specific gene expression (TRAP/Pre-IP) from AstroTRAP-APP mice (f) and mgRiboTag-APP mice (g). In c, d, f and g, each small circle indicates one mouse. Data are presented as mean ± s.e.m.
Fig. 2
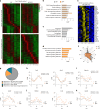
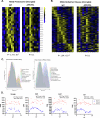
Fig. 2. Circadian transcriptional rhythms and reprogramming of bulk cortex transcripts in WT and APP/PS1 mice.
a, Heatmaps showing transcripts that were rhythmic in bulk cortex tissue from WT mice (top) and rhythmic in APP/PS1 mice (bottom). In both rows of heatmaps, the genes plotted are in the same order to compare differences in rhythmic expression among mice. bd, KEGG pathway analysis of cortex transcripts identified as rhythmic (by RAIN analysis) in (b) both WT and APP/PS1 mice, (c) WT mice or (d) APP/PS1 mice. P values for pathway enrichment are from DAVID (Fisher’s exact test). FDR-adjusted *P < 0.1. e, Heatmap showing temporally coordinated expression of KEGG lysosome pathway genes in bulk cortex from WT mice. f, Radar plot showing acrophase distributions of rhythmic bulk cortex transcripts from WT (gray) or APP/PS1 (orange) mice. g, Pie chart depicting the number of transcripts that gained or lost rhythms in different datasets, based on ‘compareRhythms’ analysis of rhythmic transcripts in bulk tissue. A total of 2,139 were identified as rhythmic by RAIN analysis across all datasets. hk, Graphs showing circadian expression patterns of transcripts from bulk cortex from WT (gray) or APP/PS1 (orange) mice. h, Core clock genes Per2 and Arntl (Bmal1) remained rhythmic. i, Senescence marker Cdkn1a and glutathione transferase Gstt2 lost rhythmicity in APP/PS1. j, Inflammatory transcripts Nfkbia and Ccl4 gained rhythmicity in APP/PS1. k, Endosomal gene Rab13 changed phase in APP/PS1. Adjusted P values from RAIN are shown. Each datapoint represents one mouse. ER, endoplasmic reticulum.
Fig. 3
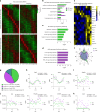
Fig. 3. Astrocyte circadian translatomes and reprogramming in WT and APP/PS1 mice.
a, Heatmaps showing transcripts that were rhythmic in WT astrocytes (top) and rhythmic in astrocytes from APP/PS1 mice (bottom). In both rows of heatmaps, the genes plotted are in the same order to compare differences in rhythmic expression between mice. bd, KEGG pathway analysis of astrocyte transcripts identified as rhythmic (by RAIN analysis) in both WT and APP/PS1 mice (b), WT mice only (c) or APP/PS1 mice only (d). P values for pathway enrichment are from DAVID (Fisher’s exact test). FDR-adjusted *P < 0.1. e, Heatmap showing temporally coordinated expression of KEGG insulin signaling pathway genes in astrocytes from WT mice. f, Radar plot showing acrophase distributions of rhythmic astrocyte transcripts from WT (green) or APP/PS1 (purple) mice. g, Pie chart depicting the number of transcripts that gained or lost rhythms in different datasets, based on ‘compareRhythms’ analysis of rhythmic transcripts in astrocytes. A total of 2,323 were identified as rhythmic by RAIN analysis across all datasets. hk, Graphs showing circadian expression patterns of transcripts from microglia from WT (green) or APP/PS1 (purple) mice. h, Core clock genes Per2 and Arntl (Bmal1) remained rhythmic. i, Cholesterol response gene Srebf1 lost rhythmicity in APP/PS1. j,k, AD-related transcripts Clu, Picalm and Chi3l1 (j), as well as chemokine Ccl3 (k), gained rhythmicity in APP/PS1. Adjusted P values from RAIN are shown. Each datapoint represents one mouse.
Fig. 4
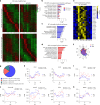
Fig. 4. Microglial circadian translatomes and reprogramming in WT and APP/PS1 mice.
a, Heatmaps showing transcripts that were rhythmic in WT microglia (top) and rhythmic in microglia from APP/PS1 mice (bottom). In both rows of heatmaps, the genes plotted are in the same order to compare differences in rhythmic expression between mice. bd, KEGG pathway analysis of microglial transcripts identified as rhythmic (by RAIN analysis) in (b) both WT and APP/PS1 mice, (c) WT mice or (d) APP/PS1 mice. P values for pathway enrichment are from DAVID (Fisher’s exact test). FDR-adjusted *P < 0.1. e, Heatmap showing temporally coordinated expression of KEGG proteasome pathway genes in microglia from WT mice. f, Radar plot showing acrophase distributions of rhythmic microglial transcripts from WT (pink) or APP/PS1 (blue) mice. g, Pie chart depicting the number of transcripts that gained or lost rhythms in different datasets, based on ‘compareRhythms’ analysis of rhythmic transcripts in microglia. A total of 6,399 were identified as rhythmic by RAIN analysis across all datasets. hk, Graphs showing circadian expression patterns of transcripts from microglia from WT (blue) or APP/PS1 (red) mice. h, Core clock genes Per2 and Arntl (Bmal1) remained rhythmic. i, Iba1-encoding gene Aif1 lost rhythmicity in APP/PS1. j, Microglial homeostasis markers Tmem119, P2ry12 and Csfr1 gained rhythmicity in APP/PS1. k, Phagocytosis receptor Mertk remained rhythmic. Adjusted P values from RAIN are shown. Each datapoint represents one mouse.
Fig. 5
Fig. 5. Circadian rhythms in microglial ROS production and amyloid plaque phagocytosis.
a, Heatmap of oscillatory genes in KEGG ROS pathway in WT microglia (mgRiboTag-seq). b, Primary microglial cultures synchronized with forskolin show time-of-day differences in the amount of ROS accumulation, as measured by CellRox fluorescence (normalized to DAPI). CT indicates hours after synchronization. Each circle represents average value from a separate experiment. P < 0.0001 by two-tailed t test. c, Heatmap of oscillatory genes in KEGG lysosome pathway in WT microglia (mgRiboTag-seq). d, Circadian rhythms in expression of three example lysosomal genes, Lamp1, Ctsl and Cd68, in microglia in WT mice in vivo (mgRiboTag-seq). RAIN adjusted P values are noted. e, Diurnal variation in microglial amyloid plaque phagocytosis in vivo. APP/PS1 mice were injected with MX04 at ZT0 or ZT12 to label amyloid plaque material, and MX04+ microglia (as a percentage of total microglia) were quantified by flow cytometry 3 h later. P = 0.0262 by one-tailed t test. In b and e, data are presented as mean ± s.e.m. Source data
Fig. 6
Fig. 6. Aging induces rhythmic expression of autophagy and mTOR pathways in astrocytes.
a, Schematic of mouse lines and lighting schedule for aging experiment. b, Heatmaps showing transcripts that were rhythmic in astrocytes from young WT mice (top) and rhythmic in aged mice (bottom). In both rows of heatmaps, the genes plotted are in the same order to compare differences in rhythmic expression between mice. c, KEGG pathway analysis of astrocyte transcripts identified as rhythmic (by RAIN analysis) in aged mice. P values for pathway enrichment are from DAVID (Fisher’s exact test). FDR-adjusted *P < 0.1. d, Heatmaps showing temporally coordinated expression of KEGG endocytosis pathway genes only in astrocytes from aged mice. eg, Graphs showing circadian expression patterns of astrocyte transcripts from young WT (green), APP/PS1 (purple) or aged (brown) mice. e, Core clock genes Per2 and Arntl (Bmal1) remain rhythmic but are induced in aged astrocytes. f,g, Autophagy genes Atg10, Pdpk1 and Ulk1 (f), as well as Mtor (g), are induced and gain rhythmicity in aged astrocytes. Adjusted P values from RAIN are shown. Each datapoint represents one mouse.
Fig. 7
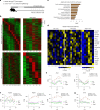
Fig. 7. Aging suppresses microglial core clock oscillation and circadian gene expression.
a, Heatmaps showing transcripts that were rhythmic in microglia from young WT mice (top) and rhythmic in aged mice (bottom). In both rows of heatmaps, the genes plotted are in the same order to compare differences in rhythmic expression between mice. b, KEGG pathway analysis of microglial transcripts identified as rhythmic (by RAIN analysis) in aged mice. P values for pathway enrichment are from DAVID (Fisher’s exact test). FDR-adjusted *P < 0.1. c, Heatmaps showing temporally coordinated expression of KEGG metabolic pathway genes in microglia from young WT, APP/PS1 and aged mice. df, Graphs showing circadian expression patterns of transcripts from microglia from WT (blue) or APP/PS1 (red) mice. d, Core clock genes Per2, Arntl (Bmal1), Nr1d1 and Ciart remained rhythmic but were blunted and suppressed in aged microglia. e, Endosomal trafficking gene Rab5c and proteasome subunit Psmd11 are induced and gain rhythmicity in aged microglia. f, The lipoprotein receptor Ldlr and transcription factor Mafg lose rhythmicity in aged microglia. Adjusted P values from RAIN are shown. Each datapoint represents one mouse.
Fig. 8
Fig. 8. Time of day of tissue collection influences differential gene expression in APP/PS1 mice.
a,b, Volcano plots showing differential gene expression in microglia between WT and APP/PS1 mice collected during the morning (AM) hours (a) or evening (PM) hours (b). A total of 506 DEGs were identified in AM, and 627 in PM. c, Comparison of fold change of induction of DEGs in microglia in WT versus APP/PS1 mice collected in AM or PM. Brown circles indicate more expression in PM; pink circles indicate more expression in AM. d,e, Genes plotted from microglia in the AM time bin (d) or PM time bin (e), including fractalkine receptor and microglia marker Cx3cr1, interferon-inducible protein Aim2, and Cd209a, known to regulate phagocytic activity. f,g, Volcano plots showing differential gene expression in astrocytes between WT and APP/PS1 mice collected during the morning (AM) hours (f) or evening (PM) hours (g). A total of 438 DEGs were identified in both AM and PM, although the specific genes differed between the two time frames. h, Comparison of fold change of induction of DEGs in astrocytes in WT versus APP/PS1 mice collected in AM or PM. Dark purple circles indicate more expression in PM; light purple circles indicate more expression in AM. i,j, Genes plotted from astrocytes in the AM time bin (i) or PM time bin (j), including WNT pathway gene Wnt7a, ciliary neurotrophic factor Cntf and AD GWAS gene, Clu (Clusterin). In c and h, only genes with fold change <3 were examined—all genes with large fold changes (>3-fold) were identified as DEGs in both AM and PM datasets. Graphs in d, e, i and j show mean ± s.e.m. P values shown are from unpaired two-tailed t tests.
Extended Data Fig. 1
Extended Data Fig. 1. Reproducible isolation of astrocyte and microglia using Ribotag and TRAP strategies.
a, Graphs depicting the reproducibility of circadian expression of core clock genes Arntl (Bmal1), Per2, Dbp, and Ciart in bulk cortex (Pre-IP) between experimental replicates. Blue circles are data from mice collected in the first experiment, and red circles are from the second circadian collection. Each datapoint represents one mouse. b,c, PCA plots of all samples used to build circadian datasets showing high degrees of separation in WT (a) and APP (b) samples, indicating reproducible cell isolation.
Extended Data Fig. 2
Extended Data Fig. 2. Circadian experimental design validation.
In silico analysis from https://5c077.shinyapps.io/Circa_in_Silico/ generated using 1,000 simulated genes, only 200 of which were truly rhythmic. a,b, Three biological replicates sampled every 2 h (a) and 2 biological replicates sampled every 2 h (b). Sampling two replicates every 2 h (b) identifies 178/200 (89%) of truly rhythmic genes. c, Genes that are identified as rhythmic in the conditions in a and b are highly similar. d, Reducing time points to increase biological replicates (N = 3 replicates every 4 h) negatively impacts circadian detection. Now, only 78.5% of truly rhythmic genes are detected. e, Acrophase plot of the true acrophase of each gene vs. the predicted acrophase when sacrificing two mice every 2 h, showing high accuracy. f, Acrophase plot of the true acrophase vs. predicted acrophase using three biological replicates every 4 h, showing a wide range of predicted acrophases.
Extended Data Fig. 3
Extended Data Fig. 3. Additional analysis of circadian gene expression in bulk cortex tissue.
a, Heatmaps showing genes from the KEGG lysosome pathway from bulk cortex tissue from WT and APP/PS1 mice. b, Graphs showing the distribution of acrophase values of rhythmic transcripts in bulk cortex from WT and APP/PS1 cortex. Transcripts are grouped by KEGG pathway. c, Circadian expression of core clock gene Ciart in bulk cortex from WT (gray) and APP/PS1 (orange) mice. d, Circadian expression of synapse gene Homer1 in bulk cortex from WT (gray) and APP/PS1 (orange) mice. For c and d, RAIN P values are shown, and each datapoint represents one mouse. e, Example genes that are rhythmic in both WT and APP bulk cortical tissue and change phase.
Extended Data Fig. 4
Extended Data Fig. 4. Additional analysis of circadian gene expression in astrocytes.
a, Heatmap of oscillatory genes in the KEGG insulin pathway in WT astrocytes (AstroTRAP) alongside the same genes plotted in APP astrocytes. b, Graphs showing the distribution of acrophase values of rhythmic transcripts in astrocytes from WT and APP/PS1 cortex. Transcripts are grouped by KEGG pathway. c, Circadian expression of core clock genes Ciart and Nr1d1 in bulk cortex from WT (green) and APP/PS1 (purple) mice. RAIN adjusted P values are shown, and each datapoint represents one mouse.
Extended Data Fig. 5
Extended Data Fig. 5. Additional characterization of circadian rhythms in gene expression in microglia.
a, Heatmap showing temporally-coordinated gene expression in microglia from WT mice for the proteasome pathway alongside the same genes plotted in APP microglia. b, Heatmap showing temporally-coordinated gene expression in microglia from WT mice for the Alzheimer’s disease pathway alongside the same genes plotted in APP microglia. c, Graph showing the acrophase of rhythmic genes in microglia from WT and APP/PS1 mice. Genes are separated by the KEGG pathway. d, Graphs depicting circadian rhythms in expression of disease-associated microglial (DAM) activation genes. Adjusted P values from RAIN are shown.
Extended Data Fig. 6
Extended Data Fig. 6. Circadian rhythms in AD risk genes.
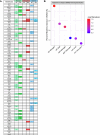
a, Table listing current AD risk genes as identified by GWAS. Each dataset is shown to the right. Colored panels marked with an X indicate that a given transcript is rhythmic in that dataset. b, Graph indicating the percent of rhythmic transcripts in each dataset that has also been identified to have SNPs in their loci in AD GWAS. Color of the circles indicates the P value from a Fisher’s test of the overrepresentation of AD GWAS genes present in each rhythmic dataset.
Extended Data Fig. 7
Extended Data Fig. 7. Data are robust when downsampled or concatenated.
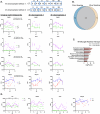
a, Datasets were downsampled from 2 h frequency (n = 2 mice/genotype/time point) to 4 h frequency (n = 4 mice/genotype/time point) by pooling adjacent samples by two different methods, as shown. Graphs of representative genes from Figs. 3 and 4 are shown for each sampling method. b, RAIN analysis of the WT mgRiboTag dataset using original 2-h sampling or 4-h downsampling (method 2) shows a >80% overlap in identified rhythms genes. c, Similar rhythmic pathways after KEGG analysis. P values are generated by DAVID (Fisher’s exact test). d, Rather than pooling, data from the two separate experimental cycles were concatenated to form a 48 h, n = 1 mouse/genotype/time point dataset, showing reproducibility.
Extended Data Fig. 8
Extended Data Fig. 8. Diurnal variation in microglia phagocytosis of amyloid plaques.
a, Schematic of experimental design depicting intraperitoneal injection of Methoxy-X04 at ZT0 or ZT12, followed by perfusion and flow cytometry of microglia. Panel a incorporates images from Servier Medical Art (https://smart.servier.com/), which was licensed under CC BY 4.0 (https://creativecommons.org/licenses/by/4.0/). b, Gating strategy used to determine the percent of microglia that have phagocytosed amyloid plaques. c, Heatmap of oscillatory genes in the KEGG lysosome pathway in WT microglia (mgRiboTag-seq) plotted next to the same genes from APP microglia.
Extended Data Fig. 9
Extended Data Fig. 9. Microglial oxidative phosphorylation gene expression loses rhythmicity in APP/PS1 mice and human AD brain.
a, Genes from the mouse KEGG oxidative phosphorylation pathway are rhythmic in microglia in WT brain but lose rhythms in APP/PS1 brain. From mgRiboTag-seq dataset. b, KEGG oxidative phosphorylation is rhythmic in microglia from control human brain but not from AD brain. CYCLOPS was used to determine circadian phase of human ROSMAP brain samples, and the microglial cluster from snRNAseq data was then analyzed for rhythmic gene expression.
Extended Data Fig. 10
Extended Data Fig. 10. Time-of-day influences differential gene expression in APP/PS1 mice in both astrocytes and microglia.
a,b, Representative genes plotted from WT and APP microglia in the AM time bin (a) or PM time bin (b). c, Volcano plots of differentially expressed AD GWAS genes in binned AM or PM WT microglia compared to APP microglia/astrocytes. d, Venn diagram analysis of the genes with an adjusted P value < 0.05 and fold change >1.5 comparing WT and APP/PS1 mice separated by the AM and PM microglia time bins. e,f, Representative genes plotted from WT and APP astrocytes in the AM time bin (e) or PM time bin (f). g, Volcano plots of differentially expressed AD GWAS genes in binned AM or PM WT astrocytes compared to APP microglia/astrocytes. h, Venn diagram analysis of the genes with an adjusted P value < 0.05 and fold change >1.5 comparing WT and APP/PS1 mice separated by the AM and PM astrocyte time bins. Graphs in (a,b,e,f) show mean ± SEM. **P < 0.01, ***P < 0.001 by unpaired two-tailed t test.

Update of

References

    1. Zhang, R., Lahens, N. F., Ballance, H. I., Hughes, M. E. & Hogenesch, J. B. A circadian gene expression atlas in mammals: implications for biology and medicine. Proc. Natl Acad. Sci. USA111, 16219–16224 (2014). - PMC - PubMed
    1. Panda, S. et al. Coordinated transcription of key pathways in the mouse by the circadian clock. Cell109, 307–320 (2002). - PubMed
    1. Sato, S. et al. Circadian reprogramming in the liver identifies metabolic pathways of aging. Cell170, 664–677 (2017). - PMC - PubMed
    1. Debski, K. J. et al. The circadian dynamics of the hippocampal transcriptome and proteome is altered in experimental temporal lobe epilepsy. Sci. Adv.6, eaat5979 (2020). - PMC - PubMed
    1. Kuintzle, R. C. et al. Circadian deep sequencing reveals stress-response genes that adopt robust rhythmic expression during aging. Nat. Commun.8, 14529 (2017). - PMC - PubMed

MeSH terms

Substances

LinkOut - more resources