. 2025 Oct 8:16:1651687.
doi: 10.3389/fimmu.2025.1651687. eCollection 2025.

High mesothelin expression is associated with low cytotoxic T cell infiltration in pancreatic cancer

Affiliations

High mesothelin expression is associated with low cytotoxic T cell infiltration in pancreatic cancer

Oliver Liang et al. Front Immunol. .

Abstract

Objectives: Mesothelin (MSLN) is a cell-surface glycoprotein overexpressed in the majority of pancreatic ductal adenocarcinoma (PDAC) cases and represents a promising immunotherapeutic target. Despite studies and clinical trials investigating MSLN-targeted immunotherapies, its biological role in PDAC carcinogenesis and influence on the tumor microenvironment remain poorly characterized. This study aims to investigate MSLN expression patterns in PDAC and assess their relationship to clinical outcomes and the immune microenvironment.

Methods: MSLN expression in 74 PDAC patients was evaluated by immunohistochemistry staining on a tissue microarray and correlated with clinicopathological features and survival outcomes. Complementary analyses of publicly available transcriptomic datasets (bulk RNA-seq and single-cell RNA-seq) were performed to characterize associations between MSLN expression and the tumor immune microenvironment with immunohistochemical validation.

Results: High MSLN expression (H-score ≥ 62) was associated with improved relapse-free survival (p = 0.021) and with increased patient age (p = 0.036). Transcriptomic analyses revealed high MSLN expression was associated with an immunosuppressive microenvironment characterized by reduced immune reactivity and diminished cytotoxic T cell infiltration. Immunohistochemical validation confirmed a trend toward decreased stromal cytotoxic T cell abundance with increasing MSLN expression.

Conclusion: This study revealed an inverse relationship between MSLN expression and cytotoxic T cell infiltration in PDAC, despite a trend toward improved relapse-free survival in MSLN-high tumors. These findings have important implications for MSLN-targeted immunotherapies and suggest that addressing the immunosuppressive microenvironment may be necessary to optimize their current responses in PDAC.

Keywords: biomarker; immunosuppression; immunotherapy; microenvironment; precision medicine.


Conflict of interest statement

The authors declare that the research was conducted in the absence of any commercial or financial relationships that could be construed as a potential conflict of interest. The author(s) declared that they were an editorial board member of Frontiers, at the time of submission. This had no impact on the peer review process and the final decision.

Figures

Figure 1
Figure 1
Expression and prognostic value of mesothelin (MSLN). (A) Distribution of MSLN expression across the cohort based on H-score cutoff of 62 (dotted line) (left). Mean ± SEM. Representative images of tissue microarray samples from the MSLN-high and MSLN-low groups (right). Scale bar = 500 µm. (B) Kaplan Meier curves of relapse-free survival of MSLN-high and MSLN-low groups. P-value was derived from log-rank test.
Figure 2
Figure 2
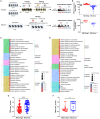
High mesothelin (human: MSLN, mouse: Msln) transcript is associated with decreased immune functions and tumor reactivity. (A) Workflow for transcriptomic analysis of human (top) and mouse (bottom) bulk RNA-sequencing datasets. (B) Human (top) and mouse (bottom) datasets were separated into MSLN-high and MSLN-low groups based on transcript expression of MSLN. Expression was quantified as normalized read counts (DESeq2). Expression thresholds for stratification are indicated (dashed lines). Top 30 biological processes from gene ontology enrichment analysis of downregulated genes in MSLN-high vs MSLN-low groups from the human (C) and mouse (D) datasets. Predicted tumor-reactive T cell signatures (TRS) scores for MSLN-high and MSLN-low groups from the human (E) and mouse (F) datasets. Statistical testing by student’s t-tests (*p < 0.05; ***p < 0.001; ns, not significant).
Figure 3
Figure 3
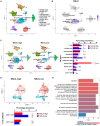
Characterization of human pancreatic cancer from single-cell transcriptomics based on mesothelin (MSLN) expression. (A) UMAP visualization showing the clustering of cells following integration of all samples. Cell type annotations represented by different colors. (B) Feature plot indicating the distribution of MSLN expression across the annotated cell clusters. Color scale shows the level of MSLN expression, with higher intensity indicating higher expression. (C) Comparison of the profiles of annotated cell types in MSLN-high and MSLN-low groups. Samples were stratified based on median MSLN normalized counts per cell. Overall landscape based on UMAP visualization (left) and quantified differences in percentage abundance (percentage out of total cells) of cell types (right). (D) T cell subtype profiles in the MSLN-high vs MSLN-low groups. (E) Bar plot of the top 10 downregulated biological processes from gene ontology analysis of CD8 T cells in MSLN-high vs MSLN-low groups. Mean ± SEM. Statistical testing by student’s t-tests (*p < 0.05; ***p < 0.001; ns, not significant).
Figure 4
Figure 4
Associations of mesothelin (MSLN) expression with T cell infiltration in tumor stroma. (A) H-score distribution of MSLN staining on tissue sections from surgical specimens. Samples were stratified into MSLN-high and MSLN-low groups based on the H-score of 62. (B) Immunohistochemical (IHC) staining of representative serial FFPE sections from samples in the MSLN-high and MSLN-low groups. Scale bar = 500 µm. (C) Correlational analysis of MSLN H-score with CD8, CD3, and CD68 scores. Linear regression model was fitted (solid line), with dashed boundaries representing the 95% confidence interval (CI). Samples classified as MSLN-high (red) and MSLN-low (blue) groups were highlighted. Correlation coefficient (r) and its 95% CI were indicated for each pair-wise analysis.

References

    1. Sarantis P, Koustas E, Papadimitropoulou A, Papavassiliou AG, Karamouzis MV. Pancreatic ductal adenocarcinoma: Treatment hurdles, tumor microenvironment and immunotherapy. World J Gastrointest Oncol. (2020) 12:173–81. doi: 10.4251/wjgo.v12.i2.173, PMID: - DOI - PMC - PubMed
    1. Bengtsson A, Andersson R, Ansari D. The actual 5-year survivors of pancreatic ductal adenocarcinoma based on real-world data. Sci Rep. (2020) 10:16425. doi: 10.1038/s41598-020-73525-y, PMID: - DOI - PMC - PubMed
    1. Loveday BPT, Lipton L, Thomson BN. Pancreatic cancer: An update on diagnosis and management. Aust J Gen Pract. (2019) 48:826–31. doi: 10.31128/AJGP-06-19-4957, PMID: - DOI - PubMed
    1. Hruban RH, Adsay NV, Albores-Saavedra J, Compton C, Garrett ES, Goodman SN, et al. Pancreatic intraepithelial neoplasia: a new nomenclature and classification system for pancreatic duct lesions. Am J Surg Pathol. (2001) 25:579–86. doi: 10.1097/00000478-200105000-00003, PMID: - DOI - PubMed
    1. Muraki T, Jang KT, Reid MD, Pehlivanoglu B, Memis B, Basturk O, et al. Pancreatic ductal adenocarcinomas associated with intraductal papillary mucinous neoplasms (IPMNs) versus pseudo-IPMNs: relative frequency, clinicopathologic characteristics and differential diagnosis. Mod Pathol. (2022) 35:96–105. doi: 10.1038/s41379-021-00902-x, PMID: - DOI - PubMed

MeSH terms

LinkOut - more resources