. 2025 Oct 24;11(43):eadu1985.
doi: 10.1126/sciadv.adu1985. Epub 2025 Oct 24.

Mendelian randomization study implicates inflammaging biomarkers in retinal vasculature, cardiovascular diseases, and longevity

Affiliations

Mendelian randomization study implicates inflammaging biomarkers in retinal vasculature, cardiovascular diseases, and longevity

Ana Villaplana-Velasco et al. Sci Adv. .

Abstract

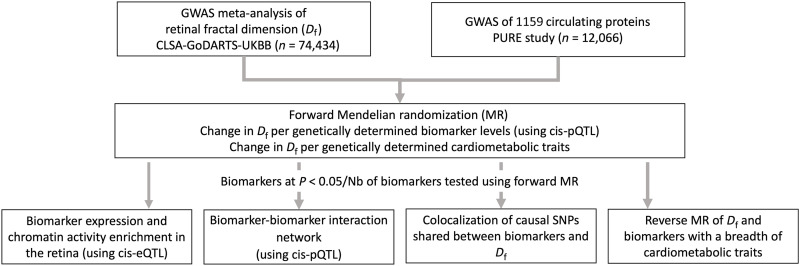
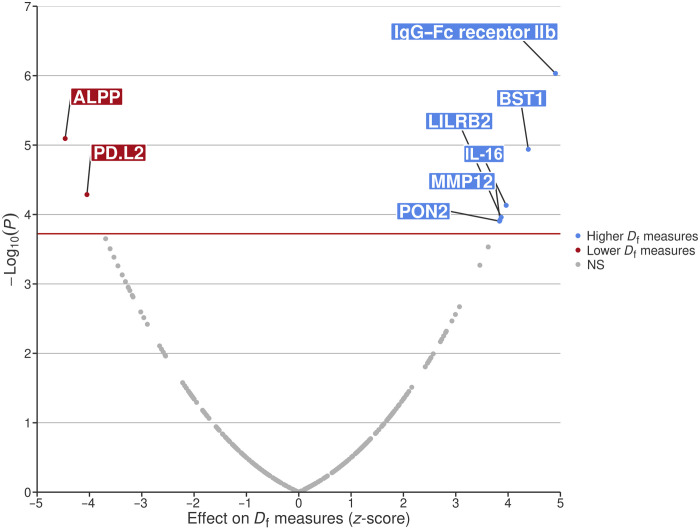
With the increasing proportion of elderly individuals, understanding biological mechanisms of aging is critical. Retinal vascular complexity, measured as fractal dimension (Df) from fundus photographs, has emerged as a vascular aging indicator. We conducted a genome-wide association study of Df on 74,434 participants from the Canadian Longitudinal Study on Aging, Genetics of Diabetes Audit and Research in Tayside Scotland, and UK Biobank cohorts. We identified a novel locus near DAAM1. We found negative genetic correlations between Df and cardiovascular disease, stroke, and inflammation but a positive correlation with life span. By combining the genetic determinants of 1159 circulating proteins from the Prospective Urban and Rural Epidemiological cohort with those of Df using Mendelian randomization, we identified eight causal mediators, including MMP12 and IgG-Fc receptor IIb, which link higher inflammation to lower Df, increased cardiovascular disease risk, and shorter life span. These results extend our understanding of the biological pathways underlying aging processes and inform targets to prevention and treatment.


Conflict of interest statement

H.C.G. holds the McMaster-Sanofi Population Health Institute Chair in Diabetes Research and Care. He reports research grants from Sanofi, Eli Lilly, Novo Nordisk, Abbott, Hanmi, and Boehringer Ingelheim; continuing education grants from Eli Lilly, Abbott, Sanofi, Novo Nordisk, and Boehringer Ingelheim; honoraria for speaking from AstraZeneca, Zuellig, and Jiangsu Hanson; and consulting or advisory board fees from Abbott, Shionogi, Zealand, Pfizer, Novo Nordisk, Eli Lilly, Bayer, and Biolinq, outside the submitted work. E.P.-C started working at the Regeneron Genetics Center LLC during the completion of this study. No data from Regeneron was used in the study. A.V.-V., N.P., Y.H., M.C., E.T., M.R.K.M., W.N., J.P., R.P., S.Y., M.O.B., A.T., K.R., G.P., A.D., and M.P. report no competing interests.

Figures

Fig. 1.
Fig. 1.. Study design.
First, we conducted a large GWAS meta-analysis on retinal Df from three cohorts (CLSA, the GoDARTS, and the UKBB). We next performed a proteome-wide MR analysis, which combined genetic determinants of 1159 circulating protein biomarkers from individuals enrolled in the PURE study with Df. Then, we conducted pathway enrichment analyses, protein interaction network, colocalization, and phenome-wide MR of identified biomarkers to dissect the links between microvascular branching complexity and cardiovascular diseases and longevity. Nb, number.
Fig. 2.
Fig. 2.. Manhattan plot of the GWAS meta-analysis (CLSA-GoDARTS-UKBB) for Df.
The x axis corresponds to the chromosome position, and the y axis corresponds to the −log10(P value) and is truncated at 20 for clarity. Bold gene names indicate significant and suggestive associations.
Fig. 3.
Fig. 3.. Volcano plot of circulating biomarkers associated with Df, identified by MR.
The x axis corresponds to the effect of each biomarker on Df measure (given in z-score values); the y axis corresponds to the −log10(P value), obtained using inverse variance weighted (IVW) MR method. The horizontal red line corresponds to the Bonferroni significant P value threshold. ALPP, alkaline phosphatase, placental type; PDL2, programmed cell death 1 ligand 2; IgG–Fc RecIIb, immunoglobulin G–Fc receptor IIb; BST1, bone marrow stromal antigen 1; LILRB2, leukocyte immunoglobulin-like receptor subfamily B member 2; IL-16, pro–interleukin-16; MMP12, matrix metalloproteinase-12; PON2, serum paraoxonase/arylesterase 2; NS, not significant.
Fig. 4.
Fig. 4.. Heatmap of the associations between significant biomarkers for Df and cardiometabolic outcomes.
Hierarchical heatmap represents the effects (z-score) of each of the eight biomarkers related to Df on each of the 47 cardiometabolic outcomes. Red color corresponds to positive associations between genetically determined biomarker levels and outcomes, and blue color corresponds to negative associations; darker colors correspond to stronger associations. Dendrograms reflect the distance (or similarity) in the associations between columns (biomarker levels) and rows (outcomes). eGFRcrea, estimated Glomerular Filtration Rate from creatinine. DSST, Digit Symbol Substitution Test.
Fig. 5.
Fig. 5.. Colocalization of FCGR2B with Df.
Top left: Plots represent the associations of genetic variants with Df at the locus 1: 161.4 to 161.9 Mb, with the x axis being the chromosome location and the y axis being the log10 P value of the associations. Bottom left: Plots represent the associations of genetic variants with circulating IgG–Fc RecIIb levels (encoded by FCGR2B) at the locus 1: 161.4 to 161.9 Mb, with the x axis being the chromosome location and the y axis being the log10 P value of the associations. Right: Plots represent the genetic correlation (r2) of circulating IgG–Fc RecIIb levels with Df at the locus 1: 161.4 to 161.9 Mb, with darker colors showing stronger associations.
Fig. 6.
Fig. 6.. Protein interaction network of biomarkers associated with Df.
Figure has been generated using STRING (88) in which significant biomarkers for Df (MR association, P values of <0.001) were used as inputs. Network nodes represent proteins, and colored nodes are query proteins (in red) and first shell of interactors. Edges represent protein-protein associations.

References

    1. The Lancet Public Health , Ageing: A 21st century public health challenge? Lancet Public Health 2, e297 (2017). - PubMed
    1. L. A. Lipsitz, “Aging as a process of complexity loss,” in Complex Systems Science in Biomedicine, Topics in Biomedical Engineering International Book Series, T. S. Deisboeck, J. Y. Kresh, Eds. (Springer, 2006), pp. 641–654; 10.1007/978-0-387-33532-2_28. - DOI
    1. Guo J., Huang X., Dou L., Yan M., Shen T., Tang W., Li J., Aging and aging-related diseases: From molecular mechanisms to interventions and treatments. Sig. Transduct. Target. Ther. 7, 391 (2022). - PMC - PubMed
    1. Wu J.-H., Liu T. Y. A., Application of deep learning to retinal-image-based oculomics for evaluation of systemic health: A review. J. Clin. Med. 12, 152 (2023). - PMC - PubMed
    1. Zekavat S. M., Raghu V. K., Trinder M., Ye Y., Koyama S., Honigberg M. C., Yu Z., Pampana A., Urbut S., Haidermota S., O’Regan D. P., Zhao H., Ellinor P. T., Segrè A. V., Elze T., Wiggs J. L., Martone J., Adelman R. A., Zebardast N., Del Priore L., Wang J. C., Natarajan P., Deep learning of the retina enables phenome- and genome-wide analyses of the microvasculature. Circulation 145, 134–150 (2022). - PMC - PubMed

LinkOut - more resources