Development and external validation of a FISH-clinical nomogram for predicting overall survival in bladder cancer patients after radical cystectomy
- PMID: 41139203
- PMCID: PMC12554245
- DOI: 10.1186/s12885-025-14677-w
Development and external validation of a FISH-clinical nomogram for predicting overall survival in bladder cancer patients after radical cystectomy
Abstract
Background: Bladder cancer has notable heterogeneity. The urine-based fluorescence in situ hybridization (FISH) test can detect bladder cancer noninvasively. In this study, we aimed to construct a nomogram based on FISH results and clinical features (referred to as the FISH-clinical model) to predict the overall survival (OS) of bladder cancer patients following radical cystectomy (RC).
Methods: A total of 261 eligible patients were enrolled for this study. The SYSMH cohort was divided into training (n = 138) and internal validation (n = 70) sets; the SYSUTH cohort was used for external validation (n = 53). Multivariate Cox proportional hazards regression was applied for FISH-clinical model construction, and model performance was evaluated according to analyses of calibration, discrimination ability, and clinical usefulness.
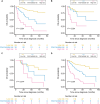
Results: FISH-identified chromosome 7 and 17 aneuploidies correlated significantly with increased pT stage; the former was associated with lymph node metastasis. Six variables, age, tumor size, pT stage, lymphovascular invasion, chromosome 7 aneuploidy, and p16 locus loss, were found to be independent predictors of OS and were incorporated into our FISH-clinical model. The model demonstrated good calibration and discrimination, with C-indexes (95% CIs) of 0.772 (0.693-0.851), 0.712 (0.605-0.819) and 0.705 (0.587-0.822), in the training, internal validation and external validation sets respectively. Decision curve analysis demonstrated the model's clinical utility. Furthermore, all enrolled patients were successfully categorized into high-, medium- or low-risk groups, and stratified analyses were performed.
Conclusions: Preoperative FISH has predictive value for OS, and we developed a FISH-clinical model for OS prediction in bladder cancer patients who have not received neoadjuvant chemotherapy or immunotherapy. This model showed favorable predictive efficacy with internal and external validation.
Keywords: Bladder cancer; Fluorescence in situ hybridization; Nomogram; Overall survival; Radical cystectomy.
© 2025. The Author(s).
Conflict of interest statement
Declarations. Ethics approval and consent to participate: Approval for this study was obtained from the Ethics Review Boards at Sun Yat-Sen Memorial Hospital and the Third Affiliated Hospital of Sun Yat-Sen University and in conformity to the Declaration of Helsinki. The need to obtain informed consent from the patients was waived because of the retrospective nature of the study. Consent for publication: Not applicable. Competing interests: The authors declare no competing interests.
Figures


References
-
- Siegel RL, Miller KD, Wagle NS, Jemal A. Cancer statistics, 2023. CA Cancer J Clin. 2023;73(1):17–48. - PubMed
-
- Alfred Witjes J, Max Bruins H, Carrion A, Cathomas R, Comperat E, Efstathiou JA, Fietkau R, Gakis G, Lorch A, Martini A, et al. European association of urology guidelines on Muscle-invasive and metastatic bladder cancer: summary of the 2023 guidelines. Eur Urol. 2024;85(1):17–31. - PubMed
-
- Babjuk M, Burger M, Capoun O, Cohen D, Compérat EM, Dominguez Escrig JL, Gontero P, Liedberg F, Masson-Lecomte A, Mostafid AH, et al. European association of urology guidelines on Non-muscle-invasive bladder Cancer (Ta, T1, and carcinoma in Situ). Eur Urol. 2022;81(1):75–94. - PubMed
-
- Ma G, Yang X, Liang Y, Wang L, Li D, Chen Y, Liang Z, Wang Y, Niu H. Precision medicine and bladder cancer heterogeneity. Bull Cancer. 2018;105(10):925–31. - PubMed
Publication types
MeSH terms
Grants and funding
LinkOut - more resources
Full Text Sources
Medical

