. 2025 Oct 24;15(10):e72298.
doi: 10.1002/ece3.72298. eCollection 2025 Oct.

Estimating (Non)Linear Selection on Reaction Norms: A General Framework for Labile Traits

Affiliations

Estimating (Non)Linear Selection on Reaction Norms: A General Framework for Labile Traits

Jordan S Martin et al. Ecol Evol. .

Abstract

Individual reaction norms describe how labile phenotypes vary as a function of organisms' expected trait values (intercepts) and plasticity across environments (slopes), as well as their degree of stochastic phenotypic variability or predictability (residuals). These reaction norms can be estimated empirically using multilevel, mixed-effects models and play a key role in ecological research on a variety of behavioral, physiological, and morphological traits. Many evolutionary models have also emphasized the importance of understanding reaction norms as a target of selection in heterogeneous and dynamic environments. However, it remains difficult to empirically estimate nonlinear selection on reaction norms, inhibiting robust tests of adaptive theory and accurate predictions of phenotypic evolution. To address this challenge, we propose generalized multilevel models for estimating stabilizing, disruptive, and correlational selection on the reaction norms of labile traits, which can be applied to any repeatedly measured phenotype using a flexible Bayesian framework. Our modeling approach avoids inferential bias by simultaneously accounting for uncertainty in reaction norm parameters and their potentially nonlinear fitness effects. We formally introduce these nonlinear selection models and provide detailed discussion on their interpretation and potential extensions. We then validate their application in a Bayesian framework using simulations. We find that our models facilitate unbiased Bayesian inference across a broad range of effect sizes and desirable power for hypothesis tests with large sample sizes. Coding tutorials are further provided to aid empiricists in applying these models to any phenotype of interest using the Stan probabilistic programming language in R. The proposed modeling framework should, therefore, readily enhance tests of adaptive theory for a variety of labile traits in the wild.

Keywords: complex trait; flexibility; multivariate; personality; phenotypic evolution; plasticity.


Conflict of interest statement

The authors declare no conflicts of interest.

Figures
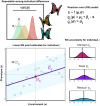
FIGURE 1
FIGURE 1
Empirical estimation of individual reaction norms. Repeatable among‐individual differences varη (top left; Equations S1 and S2: Appendix S1) in the expected value μ and dispersion σ of observed phenotype z can be predicted with a RN model (top right) using link functions g and three (or more) distinct parameters: RN intercept parameters μ0 describing each individual's average phenotype across a mean‐centered environment or in the absence of the environment (i.e., when the environmental state x = 0); RN slope parameters βx describing each individual's systematic change in phenotype across environmental states x; and RN residual parameters σ0 reflecting each individual's degree of stochastic variability (or, conversely, their predictability/precision) in phenotype within a given environment. Note that simply indicates element‐wise multiplication of each environmental state with the corresponding individual slope. See Equation (1) for individual‐level index notation. These parameters will be unknown in empirical research and must be estimated using raw measurements (teal circles) across environmental states (bottom left). An example is shown for a simple linear RN with a log‐link on the dispersion of a normal distribution, so that an individual's residual parameter, expressed as a variance on the squared log scale sqrtexpσ0+σ0j, is proportional to () the spread of observed residuals on the original data scale, as shown here by a 95% credible interval. Failure to account for uncertainty around point estimates of individual j's RN parameters (bottom right) leads to anticonservative inference and increased risk of false positives (Hadfield et al. 2010).
FIGURE 2
FIGURE 2
Removing nonrepeatable effects from selection gradients. The diagram shows causal pathways (directional arrows) by which repeatable (green) and nonrepeatable (gray) effects can influence selection gradients of fitness (W) on phenotype (z). Nonrepeatable, stochastic effects influence both fitness and phenotype (directional arrows) and may be correlated (double‐headed arrow), introducing statistical noise into the selection analysis. This leads to biased directional β* and quadratic gradients γ* when observed variance in the phenotype var( z ) is used to estimate selection across environments. However, if the (non)linear relationships between phenotype and fitness are modeled independently of stochastic effects on the phenotype var(ξ), using RN parameters μ0,βx, and σ0 (Equations 1 and 2), unbiased selection gradients β and γ can be estimated (Equations S3–S5: Appendix S1) directly for repeatable among‐individual differences in the phenotype var(η) (Equations S1 and S2: Appendix S1). Spatiotemporal fluctuations Δ can also occur in these selection gradients, which can be described by interactive selection effects (see Equations S8 and S9.2: Appendix S1 for further discussion), and any repeatable among‐individual differences in fitness unexplained by RN parameters can be estimated with random effects W0 when repeated fitness measures are available (Equation 2).
FIGURE 3
FIGURE 3
Model performance for inferring (non)linear selection on RNs. Results are shown for inferred selection gradients across 500 simulated datasets used to estimate the (non)linear selection model for RNs (Equation 2) with Gaussian phenotype and fitness measures. Each row shows a model performance metric: Bias (true value—median estimate), root mean square deviation (RMSD; the square root of the average squared deviation between true and estimated posterior values), and the posterior probability (“power”) in support of positive directional or quadratic selection (p+). Columns show how these metrics change across simulated datasets as a function of the number of subjects (N), the number of phenotypic measures per subject (t z), the number of fitness measures per subject (t w), the mean absolute correlation among RN parameters (cor¯), and the size of directional (β) and quadratic (γ) selection effects. General patterns were summarized using second‐order polynomials across conditions, which are color‐coded by RN parameter (bottom legend).

References

    1. Acker, P. , Daunt F., Wanless S., et al. 2023. “Hierarchical Variation in Phenotypic Flexibility Across Timescales and Associated Survival Selection Shape the Dynamics of Partial Seasonal Migration.” American Naturalist 201, no. 2: 269–286. - PubMed
    1. Araya‐Ajoy, Y. G. , and Dingemanse N. J.. 2014. “Characterizing Behavioural ‘Characters’: An Evolutionary Framework.” Proceedings of the Royal Society B: Biological Sciences 281: 20132645. - PMC - PubMed
    1. Araya‐Ajoy, Y. G. , Dingemanse N. J., Westneat D. F., and Wright J.. 2023. “The Evolutionary Ecology of Variation in Labile Traits: Selection on Its Among‐ and Within‐Individual Components.” Evolution 77: 2246–2256. - PubMed
    1. Araya‐Ajoy, Y. G. , Mathot K. J., and Dingemanse N. J.. 2015. “An Approach to Estimate Short‐Term, Long‐Term and Reaction Norm Repeatability.” Methods in Ecology and Evolution 6, no. 12: 1462–1473.
    1. Araya‐Ajoy, Y. G. , Westneat D. F., and Wright J.. 2020. “Pathways to Social Evolution and Their Evolutionary Feedbacks.” Evolution 74, no. 9: 1894–1907. - PubMed

LinkOut - more resources