. 2025;2(1):37.
doi: 10.1038/s44385-025-00041-x. Epub 2025 Oct 24.

A 3D spheroid model for assessing nanocarrier-based drug delivery to solid tumors

Affiliations

A 3D spheroid model for assessing nanocarrier-based drug delivery to solid tumors

Chitra Yadav et al. NPJ Biomed Innov. 2025.

Abstract

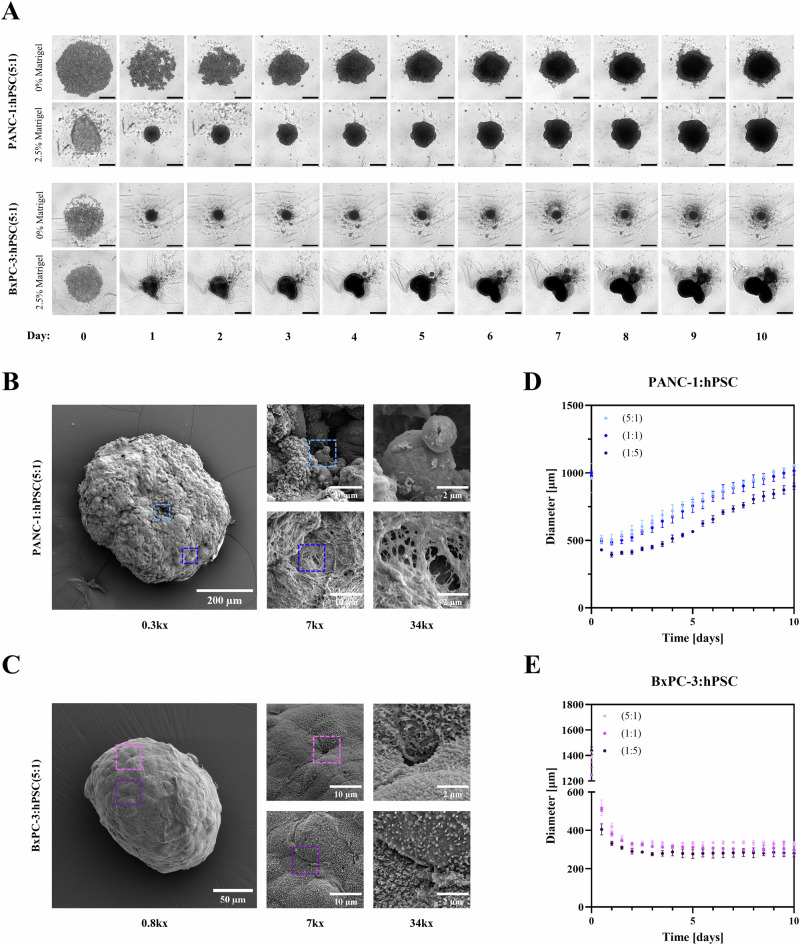
3D spheroid culture has emerged as a valuable tool for studying complex intratumoral processes and screening novel therapeutics in vitro. However, spheroids face reproducibility and data interpretation issues, which limit their utility. This work describes a simple and reproducible co-culture spheroid model compatible with high-throughput screening designed to study pancreatic ductal adenocarcinoma (PDAC), a highly therapy-resistant cancer. These spheroids, composed of both cancer and stromal cells, recapitulate key features of PDAC which are difficult to study in traditional 2D cell culture, including hypoxia, fibrosis and chemoresistance. Light sheet microscopy is used to study the tissue penetration of polymeric Pluronic® F127-polydopamine (PluPDA) nanocarriers (NCs) in this model while showing that confocal microscopy is not suitable for such studies and should be avoided. Additionally, the efficacy of PluPDA NCs loaded with the chemotherapeutic SN-38 is demonstrated in 3D, justifying their advancement to in vivo trials. Finally, the methodology is extended to generate lung adenocarcinoma spheroids, showcasing the versatility of this approach. Overall, this research is intended to serve as a robust platform for studying NCs under physiologically relevant conditions, ultimately resulting in a more efficient clinical translation pathway for nanomaterials.

Keywords: Cancer models; Nanoparticles; Pancreatic cancer.


Conflict of interest statement

Competing interestsThe authors declare no competing interests.

Figures

Fig. 1
Fig. 1. An introduction to 3D spheroid culture.
A Graphical summary of the benefits and challenges of 3D spheroid culture. B Schematic of the experimental pipeline for spheroid generation used in this study (created using Biorender.com).
Fig. 2
Fig. 2. Characterization of spheroid size, morphology and growth dynamics.
A Incucyte® images of PANC-1:hPSC(5:1) and BxPC-3:hPSC(5:1) spheroids grown with and without supplementation with 2.5% Matrigel® for 10 days. Scale bars represent 500 µm. B Scanning electron microscopy characterization of PANC-1:hPSC(5:1) and C BxPC-3:hPSC(5:1) spheroids showing different surface morphologies. D Evolution of PANC-1:hPSC and (E) BxPC-3:hPSC spheroid diameter over time, calculated from Incucyte® images, as a function of cancer-to-stellate cell ratio.
Fig. 3
Fig. 3. Characterization of internal spheroid organization by confocal microscopy.
A Schematic representation of the experimental pipeline used for spheroid sectioning, staining and imaging (created with Biorender.com). B Confocal microscopy images showing PANC-1:hPSC(5:1) and BxPC-3:hPSC(5:1) spheroid sections stained for proliferation (Ki-67 immunostaining, orange), apoptosis (TUNEL assay, green), hypoxia (Hypoxyprobe™ assay, yellow) and ECM deposition (fibronectin immunostaining, pink).
Fig. 4
Fig. 4. Microscopy techniques to study NC penetration into spheroids.
A Schematic representation of the experimental pipeline used for spheroid preparation and imaging (created with Biorender.com). B Z-stack confocal laser scanning microscopy images of a BxPC-3:hPSC spheroid incubated with rhodamine B-labeled polydopamine-Pluronic® F127 NCs. Optical sections are shown for every 10 µm up to a depth of 100 µm. C Light sheet fluorescence microscopy images of the same spheroid. Optical sections are shown for every 30 µm up to a depth of 300 µm. D Orthogonal slices of the whole spheroid generated for both techniques. In all images, NCs are shown in red and cell nuclei, stained with SYTOX™ Green, are shown in blue. All scale bars represent 100 µm.
Fig. 5
Fig. 5. Spheroid response to chemotherapy.
A Incucyte® images of BxPC-3:hPSC and PANC-1:hPSC spheroids after treatment with a range of SN-38 concentrations for 72 hours. Scale bars represent 500 µm. B Dose responses of 2D PANC-1 and hPSC monocultures and PANC-1:hPSC spheroids to SN-38. C Dose responses of 2D BxPC-3 and hPSC monocultures and BxPC-3:hPSC spheroids to SN-38. Viability was quantified using CellTiter Glo® and data were compared using two-way ANOVA. Statistically non-significant differences were not labeled. D Evolution of PANC-1:hPSC spheroid diameter over time following treatment with SN-38 calculated from Incucyte® images. E Dose response of BxPC-3:hPSC spheroids to free SN-38 and SN-38 encapsulated in PluPDA NCs (SN-38@PluPDA) quantified by CellTiter Glo®. Data were compared using two-way ANOVA.
Fig. 6
Fig. 6. Characterization of the lung cancer spheroid model.
A Incucyte® images of A549:WI-38 spheroids grown with and without supplementation with 2.5% Matrigel® for 7 days. Scale bars represent 500 µm. B Confocal microscopy images showing A549:WI-38 spheroid sections stained for proliferation (Ki-67 immunostaining, orange) and ECM deposition (fibronectin immunostaining, pink). C Evolution of spheroid diameter over time, calculated from Incucyte® images. D Integrated fluorescence intensity for all biomarkers across the entire spheroid section area for A549:WI-38, determined using the Radial Profile Extended plugin in ImageJ. Normalized radii of 0 and 1 represent the spheroid’s center and edge respectively.
Fig. 7
Fig. 7. Visual aid for preparing spheroids for sectioning.
A A spheroid is removed from its 96-well plate using a 1 mL pipette tip with the bottom ~ 5 mm cut off to increase its diameter. B The spheroid after transfer to a cylindrical glass vial and medium removal. C The spheroid submerged under ~ 1 cm of OCT compound. D The spheroid after freezing in liquid nitrogen for 30 seconds. The side of the glass vial was marked to facilitate finding the spheroid during sectioning. E The block of OCT after being pulled out of the vial with tweezers. F The block of OCT attached to a cryostat chuck using a drop of OCT, then briefly solidified at −20 °C.

References

    1. Dowden, H. & Munro, J. Trends in clinical success rates and therapeutic focus. Nat. Rev. Drug Discov.18, 495–496 (2019). - PubMed
    1. Sun, D., Gao, W., Hu, H. & Zhou, S. Why 90% of clinical drug development fails and how to improve it?. Acta Pharm. Sin. B12, 3049–3062 (2022). - PMC - PubMed
    1. Elmore, L. W. et al. Blueprint for cancer research: critical gaps and opportunities. CA Cancer J. Clin.71, 107–139 (2021). - PubMed
    1. Yan, H. H. N., Chan, A. S., Lai, F. P.-L. & Leung, S. Y. Organoid cultures for cancer modeling. Cell Stem Cell30, 917–937 (2023). - PubMed
    1. Biju, T. S., Priya, V. V. & Francis, A. P. Role of three-dimensional cell culture in therapeutics and diagnostics: an updated review. Drug Deliv. Transl. Res.13, 2239–2253 (2023). - PMC - PubMed

LinkOut - more resources