. 2025 Oct 27;6(1):87.
doi: 10.1186/s43556-025-00339-7.

Dihydroorotate dehydrogenase inhibition activates STING pathway and pyroptosis to enhance NK cell-dependent tumor immunotherapy

Affiliations

Dihydroorotate dehydrogenase inhibition activates STING pathway and pyroptosis to enhance NK cell-dependent tumor immunotherapy

Yongrui Hai et al. Mol Biomed. .

Abstract

Cancer cells rely heavily on de novo pyrimidine synthesis. Inhibiting pyrimidine metabolism directly suppresses tumor growth and fosters immune activation within the tumor microenvironment. Dihydroorotate dehydrogenase (DHODH) is a key enzyme in the de novo pyrimidine synthesis pathway. Inhibiting DHODH can reverse immune suppression and trigger a mild innate immune response. However, the impact of DHODH inhibition on natural killer (NK) cells remains to be explored. In this study, we found that DHODH inhibition promoted NK cell infiltration into tumors efficiently. Mechanistically, DHODH suppression induced mitochondrial oxidative stress, leading to mitochondrial DNA (mtDNA) release into the cytoplasm through voltage-dependent anion channel (VDAC) oligomerization and caspase-3 activation. This subsequently activated the stimulator of interferon gene (STING) pathway, triggered ferroptosis, and induced gasdermin E (GSDME) mediated pyroptosis in cancer cells. These changes collectively facilitated NK cell recruitment. Furthermore, infiltrated NK cells enhanced GSDME-dependent pyroptosis in tumor cells through granzyme release, establishing a positive feedback loop that amplified anti-tumor immunity. Additionally, we developed EA6, a novel DHODH inhibitor that is more effective at promoting NK cell infiltration. In summary, this study reveals that targeting pyrimidine metabolism activates a novel mechanism involving pyroptosis-ferroptosis crosstalk and STING pathway activation to enhance NK cell-mediated immunity. These finding opens new avenues for enhancing the efficacy of targeted nucleotide metabolism in cancer therapy.

Keywords: CGAS-STING pathway; DHODH; NK cells; Pyrimidine metabolism; Pyroptosis.


Conflict of interest statement

Declarations. Ethics approval and consent to participate: Ethics approval was granted by the Ethics Committee of Northwestern Polytechnical University. Animal experiments were carried out according to the Animal Experiment Center of Northwestern Polytechnical University Animal Care and Use Guidelines (NO. 202201173). Consent for publication: Not applicable. Competing interests: The authors declare that they have no competing interests.

Figures
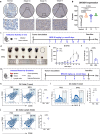
Fig. 1
Fig. 1
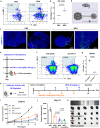
BRQ restrains melanoma growth. a Representative images of immunohistochemical staining of DHODH. Melanoma staging by Clark classification. b Immunohistochemistry score of DHODH in normal tissues (n = 8) and different grades tissue samples of melanoma (grade Ⅲ: n = 10; grade Ⅳ: n = 26; grade Ⅴ: n = 17). c Experiment scheme for BRQ therapy of the B16F10 tumor bearing C57BL/6 female mouse model. d Images of isolated tumors at the end of the experiment (n = 6). e Tumor growth in the indicted groups of mice (n = 6). f The average tumor weight at the end of the experiment (n = 6). g Immune experiment scheme of the B16F10 tumor bearing C57BL/6 female mouse model. h Representative flow cytometry images and quantitative graph of DC cells (CD11c+ CD80+ CD86+) in tumor (n = 3). i Representative flow cytometry images and quantitative graph of DC cells (MHC Ⅱ.+) in tumor (n = 3). j Representative flow cytometry images and quantitative graph of DC cells in lymph nodes (n = 3)
Fig. 2
Fig. 2
BRQ triggers NK cells infiltration in tumor. a-b Representative flow cytometry images and quantitative graph of NK cells in tumor (n = 3). c Representative immunofluorescence images of tumor-infiltrating NK cells. d Schematic representation of BRQ induced anti-tumor immune response. e Schematic representation of NK depletion experiment. f-g Representative flow cytometry images and quantification of NK cells in spleen after treatment with anti-IgG2α or anti-NK1.1 antibody (n = 3). h Experiment scheme for BRQ therapy with NK depletion. i Tumor growth curves in the various groups of mice (n = 5). j Average tumor volume at Day 15 of each group (n = 5). k Images of isolated tumors at the end of experiment in NK depletion experiment (n = 5)
Fig. 3
Fig. 3
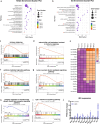
RNA-Seq analysis of B16F10 cells treated with BRQ. a KEGG enrichment analysis of DEGs after BRQ treatment. b GO enrichment analysis of DEGs after BRQ treatment. c GSEA analysis of immune response. d GSEA analysis of NK cells activation. e Specific genes related to NK cells activation. f GSEA analysis of cytokine mediated signaling pathway. g GSEA analysis of TNF mediated signaling pathway. h GSEA analysis of TGF-β signaling pathway. i GSEA analysis of IFN-Ⅰ signaling pathway. j ISG expression between the BRQ group and the control group
Fig. 4
Fig. 4
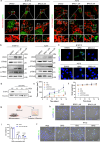
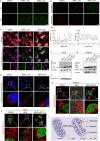
BRQ activates cGAS-STING pathway to enhance the anti-tumor immunity of NK cells. a CLSM images of mtDNA released from mitochondrial in B16F10 and A375 (Red: mitochondrial; green: DNA). b Western blot analysis of protein involved in cGAS-STING pathway. c p-STING expression in B16F10 and A375 cells with DMSO, BRQ (5 μM) or BRQ (5 μM) plus uridine (100 μM). d Verification of STING protein knockdown efficiency. e B16F10 tumor growth in mice treated with PBS, BRQ (30 mg/kg, i.p.) (n = 5). f Body weight of mice (n = 5). g In vitro experiments for NK cells infiltration after treatment: A375 cells were pretreated with BRQ for 24 h and then co-cultured with NK-92 cells in a transwell system. h Images of NK-92 contact with pretreated A375 cells as shown in g (green: NK-92 label with CFSE, blue: A375 label with DAPI). i Cell viability of A375 cells cocultured or not with NK-92 cells after pretreated with BRQ. The A375 alone or co-cultured with NK-92 cells without drug treatment were used as control, respectively (n = 6). j Images of NK-92 contact with A375 cells. A375 cells were pretreated with BRQ and then treated with or without IFN-β as shown in g (green: NK-92 label with CFSE, blue: A375 label with DAPI)
Fig. 5
Fig. 5
BRQ induces pyroptosis in melanoma cells and synergizes with NK cells. a-b Representative images of morphological alterations after BRQ treatment in B16F10 and A375. Arrow indicated cell swelling and rupture. c Western blot analysis of GSDME and caspase 3 in B16F10 and A375. d-e LDH released in culture supernatants after BRQ treatment in B16F10 and A375 cells (n = 3). f-g ATP released in culture supernatants after BRQ treatment in B16F10 and A375 cells (n = 3). h Western blot analysis of GSDME in tumor tissues (n = 3). i Tumor growth curves in different experimental groups (n = 6). j Western blot analysis of GSDME in untreated, uridine treated, BRQ treated or BRQ and uridine treated tumor cells. k In vitro experiments for NK cells enhancing tumor cells pyroptosis: A375 cells were treated with BRQ for 24 h and then co-cultured with NK-92 cells for 2 h to analysis the expression of GSDME in A375 cells. l Western blot analysis of GSDME in indicated groups as shown in k. m Schematic representation of NK cells aggravation of cancer cells pyroptosis
Fig. 6
Fig. 6
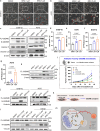
BRQ induces mitochondrial oxidative stress and mtDNA released via VDAC. a ROS was detected by DCFH-DA in A375 cells. b JC-1 analysis in A375 cells. c Representative images of A375 co-stained BODIPY C11 (Oxidized BODIPY-green/non oxidized BODIPY-red) and mitochondrial (purple). d Colocalization analysis of mitochondrial and oxidized BODIPY in c. e Representative images of A375 co-stained mitochondrial(red) and GSDME (green). DAPI was used to stain nuclei. f Western blot analysis of VDAC and BAX in A375 cells. g Western blot analysis of VDAC in A375 cells. h-i CLSM images of mtDNA released from mitochondrial in (h) B16F10 and (i) A375 (Red: mitochondrial; green: DNA). j Schematic showing the release of mtDNA from mitochondria
Fig. 7
Fig. 7
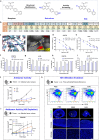
EA6, a more effective DHODH inhibitor. a Structural transformation from BRQ to EA6. b IC50 values of BRQ and BRQ derivatives drugs to B16F10 cell lines at 72 h. c Comparison of the binding sites of BRQ (blue) and EA6 (gray) with DHODH (PDB ID:1D3G). d-e Cell viability in B16F10 or A375 treated with BRQ or EA6 (n = 3). f-g Cell viability in B16F10 or A375 treated with EA6 or EA6 + uridine (n = 3). h-i Cell viability in B16F10 or A375 treated with uridine or uridine + EA6 (n = 3). j B16F10 tumors growth in mice treated with vehicle, BRQ (30 mg/kg, i.p.) or EA6 (30 mg/kg, i.p.) once ever two days (n = 5). k Representative flow cytometry images and immunofluorescence images of NK cells in tumors from PBS, BRQ (30 mg/kg, i.p.) or EA6 (30 mg/kg, i.p.) treated mice. Mice were treated every two days, and after three times the tumors was collected for testing. l B16F10 tumor growth in mice treated with PBS, EA6 (30 mg/kg, i.p.), the combination of EA6 (30 mg/kg, i.p.) and anti-IgG2α (300 ug, i.p.) or the combination of EA6 (30 mg/kg, i.p.) and anti-anti-NK1.1(300 ug, i.p.) (n = 3)
Fig. 8
Fig. 8
Anti-tumor mechanisms of DHODH inhibition. DHODH inhibition induces mitochondrial oxidative stress and VDAC oligomerization, leading to mitochondrial DNA release and subsequent activation of the cGAS-STING pathway. This promotes NK cell infiltration into tumors. Infiltrating NK cells enhance GSDME-mediated pyroptosis in cancer cells, while mitochondrial oxidative stress concurrently triggers ferroptosis. These processes establish a positive feedback loop that amplifies the anti-tumor immune response

References

    1. Ali ES, Ben-Sahra I. Regulation of nucleotide metabolism in cancers and immune disorders. Trends Cell Biol. 2023;33(11):950–66. 10.1016/j.tcb.2023.03.003. - PMC - PubMed
    1. Mullen NJ, Singh PK. Nucleotide metabolism: a pan-cancer metabolic dependency. Nat Rev Cancer. 2023;23(5):275–94. 10.1038/s41568-023-00557-7. - PMC - PubMed
    1. Wu HL, Gong Y, Ji P, Xie YF, Jiang YZ, Liu GY. Targeting nucleotide metabolism: a promising approach to enhance cancer immunotherapy. J Hematol Oncol. 2022;15(1):45. 10.1186/s13045-022-01263-x. - PMC - PubMed
    1. Siddiqui A, Ceppi P. A non-proliferative role of pyrimidine metabolism in cancer. Mol Metab. 2020;35:100962. 10.1016/j.molmet.2020.02.005. - PMC - PubMed
    1. Zhou Y, Tao L, Zhou X, Zuo Z, Gong J, Liu X, et al. DHODH and cancer: promising prospects to be explored. Cancer Metab. 2021;9(1):22. 10.1186/s40170-021-00250-z. - PMC - PubMed

MeSH terms

Substances

LinkOut - more resources