. 2025 Oct 3;28(11):113684.
doi: 10.1016/j.isci.2025.113684. eCollection 2025 Nov 21.

A luminescence-based biosensor to measure endogenous UBE3A activity

Affiliations

A luminescence-based biosensor to measure endogenous UBE3A activity

Lei Xing et al. iScience. .

Abstract

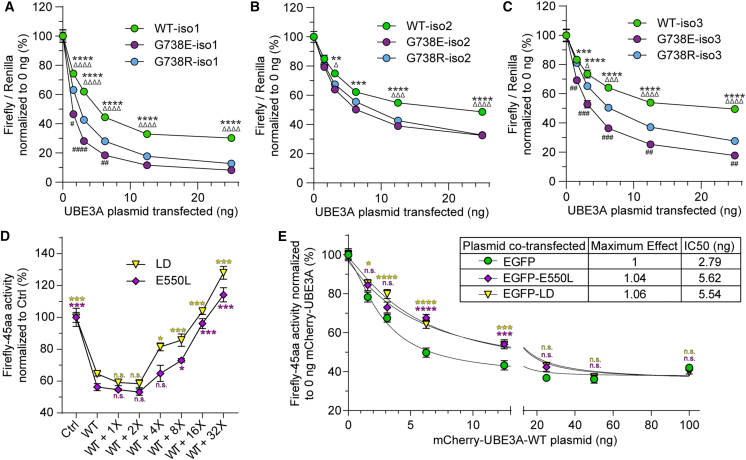
Loss- and gain-of-function (LOF and GOF) mutations in the E3 ubiquitin ligase UBE3A cause distinct neurodevelopmental disorders. The AZUL domain of UBE3A binds with low nanomolar affinity to a 45 amino acid (aa) region of PSMD4. We fused this 45-aa sequence to Firefly luciferase to generate a luminescence-based biosensor, Firefly-45aa, that acts as an artificial UBE3A substrate and exhibits exceptional sensitivity in measuring UBE3A activity. Testing UBE3A variants using Firefly-45aa in HEK293T cells revealed distinct biosensor activity profiles, enabling the classification of LOF and GOF mutations based on maximum activity, inhibitory concentration-50, and activity per unit of protein. Some strong LOF mutations had dominant negative activity. In addition, Firefly-45aa can be used to quantify endogenous UBE3A activity in primary cells from Angelman syndrome and GOF mouse models. This biosensor reveals a mutational spectrum of UBE3A enzyme activity and is a sensitive tool for functional characterization and therapeutic development in UBE3A-related disorders.

Keywords: Cellular neuroscience; Genomics; Neurogenetics.


Conflict of interest statement

The authors declare no competing interests.

Figures

None
Graphical abstract
Figure 1
Figure 1
The 45aa PSMD4 peptide interacts with UBE3A through the AZUL domain EGFP and N-terminal EGFP-tagged UBE3A constructs (human isoform 1) were expressed in HEK293T cells. Constructs: AZUL domain deleted (ΔAZUL) UBE3A, UBE3A-WT and UBE3A-ligase-dead (LD, C820A). Lysates were incubated with the biotinylated-45aa peptide and pulled down with streptavidin beads. Inputs and pellets were probed with anti-GFP antibodies.
Figure 2
Figure 2
Quantification of UBE3A activity with the Firefly-45aa biosensor (A) Localization of Firefly luciferase (Firefly-Control) and Firefly-45aa biosensor in HEK293T cells. Nuclei were labeled with DAPI and immunofluorescence staining against Lamin A/C. The biosensor was detected by immunofluorescence staining using antibodies against Firefly luciferase. Representative images show the localization of the Firefly-45aa biosensor. Scale bar = 10 μm. n represents the number of cells. (B) Firefly-45aa was co-expressed with increasing amounts of EGFP-UBE3A isoform 1 (WT-iso1), 2 (WT-iso2), or 3 (WT-iso3), followed by dual-luciferase assays 24 h after transfection. two-way ANOVA, F (2, 72) = 449.04 in plasmid amount, p < 0.0001; post hoc Tukey’s multiple comparisons test (compared to WT-iso1): ∗∗∗, p < 0.0001. n = 4. (C) Firefly-45aa or Firefly-Control was co-expressed in HEK293T cells with Renilla luciferase (internal normalization control) and either EGFP-UBE3A-WT or EGFP-UBE3A-LD(C820A). Dual-luciferase assays were performed 24 h after transfection. two-way ANOVA, F (3, 32) = 33.95 in plasmid amount, p < 0.0001; post hoc Tukey’s multiple comparisons test (compared to the 0 ng group): ∗∗∗, p < 0.0001; n.s., not significant. n = 3. (D) Sensitivity of the Firefly-45aa biosensor compared to the BAR reporter with increasing amounts of EGFP-UBE3A-WT plasmid. The Firefly-45aa biosensor or the BAR reporter was co-expressed in HEK293T cells with Renilla luciferase (internal normalization control) and EGFP-UBE3A-WT. Dual-luciferase assays were performed 48 h after transfection. two-way ANOVA, F (10, 66) = 193.1 in plasmid amount, p < 0.0001; post hoc Tukey’s multiple comparisons test (compared to the 0 ng group): ∗, p < 0.005; ∗∗∗, p < 0.0001; n.s., not significant. n = 4. In all panels, data are represented as mean ± standard error of the mean (SEM) and n represents the number of experimental repeats.
Figure 3
Figure 3
The Firefly-45aa biosensor is polyubiquitinated by UBE3A (A) Overexpression of UBE3A-WT in HEK293T cells significantly reduced protein levels of the Firefly-45aa biosensor compared to UBE3A-LD(C820A), but (B) did not alter protein levels of the Firefly control (unpaired t-test). mCherry was used as a co-transfection control for normalization. n = 3. Data are represented as mean ± SEM, and n represents the number of experimental repeats. (C) Plasmids encoding 3XHA-tagged Firefly-45aa or control (Firefly-Control) were co-expressed with EGFP-UBE3A-WT or EGFP-UBE3A-LD(C820A) as shown in the table. Total protein lysates were probed with anti-GFP and anti-HA tag antibodies. 3XHA-Firefly-Control and 3XHA-Firefly-45aa were immunoprecipitated by antibodies against the HA-tag, and immunoprecipitants were blotted with antibodies against ubiquitin and the HA-tag.
Figure 4
Figure 4
The Firefly-45aa biosensor reveals a spectrum of UBE3A LOF- and GOF-mutations (A) Volcano plot separating LOF (left) from GOF (right) mutations. EGFP-UBE3A-variant plasmids (all isoform 1) were transfected at the lowest amount (1.56 ng) in HEK293T cells along with the Firefly-45aa biosensor. The position of the dashed line is equivalent to adj. p = 0.05. (B) UBE3A variants resolved by principal component analysis (PCA). PCA was performed using levels of overexpressed UBE3A (measured as EGFP intensity) and the activity of Firefly-45aa from all co-transfection groups. Relative UBE3A activity and protein levels represent results from the 25 ng co-transfection group.
Figure 5
Figure 5
UBE3A GOF activity of each isoform and LOF dominant-negative activity (A) Isoform 1, (B) isoform 2 and (C) isoform 3 EGFP-tagged UBE3A constructs (WT, G738E and G738R) were evaluated with the Firefly-45aa biosensor in a dual-luciferase assay. For isoform 1: two-way ANOVA, F (5, 54) = 825.7 in plasmid amount, p < 0.0001; For isoform 2: two-way ANOVA, F (5, 54) = 375.2 in plasmid amount, p < 0.0001; for isoform 3: two-way ANOVA, F (5, 54) = 397.5, p < 0.0001. post hoc Tukey’s multiple comparisons test (compared to WT): ∗/#/Δ, p < 0.01, ∗∗/##/ΔΔ, p < 0.001, ∗∗∗/###/ΔΔΔ, p < 0.0005, ∗∗∗∗/####/ΔΔΔΔ, p < 0.0001. ∗, G738E compared to WT; Δ, G738R compared to WT; #, G738E compared to G738R. n = 4. (D and E) Expression of UBE3A LOF constructs interferes WT UBE3A activity as measured with the Firefly-45aa biosensor. (D) HEK293T cells were transfected with the EGFP-UBE3A-WT plasmid at 3.125 ng/well and indicated amount (in multiples of 3.125 ng) of plasmid encoding EGFP-UBE3A-LD(C820A) and E550L. The total amount of plasmid transfected per well was held constant by adding a proportionate amount of empty vector. Statistics relative to WT condition: LD, one-way ANOVA, F (7, 24) = 76.90, p < 0.0001, n = 3; E550L, one-way ANOVA, F (7, 24) = 46.13, p < 0.0001, n = 3; post hoc Dunnett’s multiple comparisons: ∗, p < 0.05; ∗∗, p < 0.005, ∗∗∗, p < 0.0001. n = 4. (E) HEK293T cells were transfected with EGFP empty vector, EGFP-E550L or EGFP-LD(C820A) plasmid at 12.5 ng/well and the indicated amount of mCherry-UBE3A-WT (isoform1) plasmid. two-way ANOVA, F (7, 96) = 405.84, p < 0.0001, n = 4; post hoc Dunnett’s multiple comparisons to the EGFP group, ∗, p < 0.05; ∗∗, p < 0.005; ∗∗∗, p < 0.0005; ∗∗∗∗, p < 0.0001; n.s., not significant. n = 4. In all panels, data are represented as mean ± SEM, and n represents experimental repeats.
Figure 6
Figure 6
Quantification of endogenous UBE3A activity with the AAV2-Firefly-45aa biosensor (A) AAV2-Firefly-Control and Firefly-45aa bicistronic vector diagrams. Expression of the Firefly-Control or the Firefly-45aa biosensor and Renilla luciferase (normalization control) was driven by the same promoter, and the translation of Renilla luciferase was mediated by an internal ribosomal entry site (IRES). AAV vectors with an EF1α promoter (pro) were generated for ubiquitous expression, or an hSyn1 promoter for neuron-specific expression. (B) Validation of the bicistronic AAV2-Firefly-45aa-IRS-Renilla and control vectors in HEK293T cells, transfected as plasmids. For Firefly-control: One-way ANOVA with post hoc Tukey’s multiple comparisons test, F (2, 18) = 3.503, p = 0.0519; n.s., not significant; n = 7. For Firefly-45aa: One-way ANOVA with post hoc Tukey’s multiple comparisons test, F (2, 18) = 521.6, p < 0.0001. n = 7. (C) Down regulation of UBE3A protein levels by ASOs against UBE3A. Total protein lysates were extracted 4 days after ASO treatment to evaluate UBE3A protein levels. Relative UBE3A levels were measured using β-actin as the normalization control and are listed below the representative western blot of UBE3A. n = 2. (D) Firefly-45aa activity in neurons treated with UBE3A ASOs at different concentrations. One day after ASO treatment, neurons were transduced with AAV2-Ef1α-Firefly-45aa-IRES-Renilla viral particles and Firefly-45aa activity was measured on DIV7 and quantified by normalization to cells untreated with ASOs (Ctrl). One-way ANOVA, F (5, 24) = 5.070, p = 0.0026, n = 5; post hoc Dunnett’s multiple comparisons test, ∗, p < 0.05; ∗∗, p < 0.005. (E) Reduced Firefly-45aa activity in Ube3aT503A (GOF mutation) neurons using the EF1α promoter-driven AAV vector relative to control AAV vector (two-way ANOVA, F (1, 10) = 7.756, p = 0.0193; post hoc Šídák’s multiple comparisons test; WT, n = 5; mT503A/p+, n = 3). (F and G) Reduced activity of Firefly-45aa driven by hSyn1 promoter in neurons from (F) Ube3amT503A/p+ mice (unpaired t-test, WT, n = 5; mT503A/p+, n = 3) and (G) Ube3aUBEAOE2+ mice (unpaired t-test, WT, n = 8; UBEAOE2+, n = 7). (H and I) Elevated Firefly-45aa activity driven by the hSyn1 promoter in cultured neurons from (H) AS model (Ube3am-/p) mice (unpaired t-test, WT, n = 8; m-/p+, n = 11), and (I) Ube3a-YFP (Ube3aUbe3a-YFP/p+) mice (unpaired t-test, WT, n = 10; mUbe3a-YFP/p+, n = 11). (J) Reduced Firefly-45aa activity, but not the Firefly control, in fibroblast cells from Ube3aT503A mice relative to WT control (two-way ANOVA, F (1, 10) = 7.756, p = 0.0193; post hoc Šídák’s multiple comparisons test; WT, n = 5; mT503A/p+, n = 3). (K and L) Elevated Firefly-45aa activity in cultured fibroblast cells from (K) AS model mice (unpaired t-test, WT, n = 5; m-/p+, n = 7) and (L) Ube3a-YFP mice (unpaired t-test, WT, n = 4; mUbe3a-YFP/p+, n = 4). For panels (B and D), n represents the number of experimental repeats; for panels (E–L), n represents the number of animals. All data are represented as mean ± SEM.

References

    1. de Bie P., Ciechanover A. Ubiquitination of E3 ligases: self-regulation of the ubiquitin system via proteolytic and non-proteolytic mechanisms. Cell Death Differ. 2011;18:1393–1402. doi: 10.1038/cdd.2011.16. - DOI - PMC - PubMed
    1. Margolis S.S., Sell G.L., Zbinden M.A., Bird L.M. Angelman Syndrome. Neurotherapeutics. 2015;12:641–650. doi: 10.1007/s13311-015-0361-y. - DOI - PMC - PubMed
    1. Kalsner L., Chamberlain S.J. Prader-Willi, Angelman, and 15q11-q13 Duplication Syndromes. Pediatr. Clin. North Am. 2015;62:587–606. doi: 10.1016/j.pcl.2015.03.004. - DOI - PMC - PubMed
    1. Weston K.P., Gao X., Zhao J., Kim K.S., Maloney S.E., Gotoff J., Parikh S., Leu Y.C., Wu K.P., Shinawi M., et al. Identification of disease-linked hyperactivating mutations in UBE3A through large-scale functional variant analysis. Nat. Commun. 2021;12:6809. doi: 10.1038/s41467-021-27156-0. - DOI - PMC - PubMed
    1. Xing L., Simon J.M., Ptacek T.S., Yi J.J., Loo L., Mao H., Wolter J.M., McCoy E.S., Paranjape S.R., Taylor-Blake B., Zylka M.J. Autism-linked UBE3A gain-of-function mutation causes interneuron and behavioral phenotypes when inherited maternally or paternally in mice. Cell Rep. 2023;42 doi: 10.1016/j.celrep.2023.112706. - DOI - PMC - PubMed

LinkOut - more resources