. 2025 Sep 25;15(10):642.
doi: 10.3390/metabo15100642.

Precision Probiotics Regulate Blood Glucose, Cholesterol, Body Fat Percentage, and Weight Under Eight-Week High-Fat Diet

Affiliations

Precision Probiotics Regulate Blood Glucose, Cholesterol, Body Fat Percentage, and Weight Under Eight-Week High-Fat Diet

Jinhua Chi et al. Metabolites. .

Abstract

Background/Objectives: Poor glycemic control is reaching an epidemic prevalence globally. It is associated with significantly morbid health concerns including retinopathy, neuropathy, nephropathy, cancer, and cardiovascular disease. Probiotics have shown promise in reducing health complications associated with poor blood glucose control. We tested a novel approach to designing a precision probiotic cocktail for improving blood glucose homeostasis. Methods: We tested the in vitro glucose consumption rate of twelve mouse microbiome bacterial strains and selected three with the greatest glucose consumption for the probiotic cocktail. The in vivo metabolic impact of ingesting the selected probiotic cocktail was evaluated in twelve C57BL/6J male mice fed a high-fat diet for eight weeks. Results: Compared to a control group, the probiotic group (L. rhamnosus, L. reuteri, and L. salivarius) exhibited significantly lower blood glucose levels, body weight, and body fat percentage. Moreover, the probiotic cocktail also demonstrated the ability to reduce serum insulin, total cholesterol, very-low-density lipoprotein/low-density lipoprotein cholesterol, and total cholesterol to high-density lipoprotein ratio. For further mechanistic investigation, untargeted metabolomics analyses uncovered overall downregulations in energy substrates and producing pathways like gluconeogenesis, acylcarnitine synthesis, glycolysis, the mitochondrial electron transport chain, the TCA cycle, and the building blocks for ATP formation. Partial least squares-discriminant analyses also confirmed clear group differences in metabolic activity. 16S rRNA sequencing from extracted gut microbiota also showed significant increases in Faith's phylogenetic diversity, Lachnospiraceae bacterium 609-strain, and the genus Muribaculaceae as well as group β-diversity differences after probiotic intake. Conclusions: As such, we successfully developed a blend of three probiotics to effectively reduce blood glucose levels in male mice, which could further mitigate adverse health effects in the host.

Keywords: Lactobacillus reuteri; Lactobacillus rhamnosus; Lactobacillus salivarius; blood glucose control; hyperglycemia; precision probiotics.


Conflict of interest statement

H.G. and P.J. are employed by the company MetaBiotics, LLC; P.J. is employed by the company Theriome Inc. The remaining authors declare that the research was conducted in the absence of any commercial or financial relationships that could be construed as a potential conflict of interest. All other authors declare no competing financial interests.

Figures

Figure 1
Figure 1
Schematic overview of our novel approach to develop precision probiotics for blood glucose control. Bacterial strains (n = 12) were tested in vitro to identify strains with the greatest glucose consumption capabilities. The top three strains were combined to produce the probiotic cocktail. The efficacy of the cocktail was then tested in vivo on C57BL/6J male mice on a high-fat diet who received oral gavages of the probiotics (n = 6) or vehicle PBS (n = 6) every other day for eight weeks. Body weight and blood glucose concentration were measured weekly. Terminal body composition was measured at eight weeks. Terminal serum and liver samples were harvested for metabolomic analysis. Fecal samples were collected for 16S rRNA sequencing and analysis. Created in BioRender. Patterson, J. (2025). Accessed on 3 July 2025. https://BioRender.com/bjkw2oe.
Figure 2
Figure 2
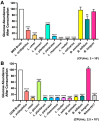
24 h glucose consumption by bacterial strains in vitro. Probiotics were incubated in (A) MRS Broth at a pH of 6.0 with a CFU/mL of 2 × 10⁷, or (B) GAM Broth at a pH of 6.99 with a CFU/mL of 2.5 × 10⁷. The graphs are presented as mean ± std. **** p < 0.0001, ** p < 0.01, * p < 0.05 vs. sterile broth, respectively.
Figure 3
Figure 3
(A) Fasting blood glucose concentration, (B) body weight, and (C) body fat percentage of C57BL/6J male mice on a high-fat diet. Mice received the precision probiotics (n = 6; blue) or vehicle PBS (n = 6; orange) via oral gavage for eight weeks. The graphs are presented as mean ± std. *** p < 0.001, ** p < 0.01, * p < 0.05.
Figure 4
Figure 4
Terminal, fasting serum (A) insulin, (B) TC, (C) TG, (D) VLDL/LDL, (E) HDL, and (F) TC/HDL. The graphs are presented as mean ± std. * p < 0.05.
Figure 5
Figure 5
Heatmap of the significant metabolites (p < 0.05) from the terminal serum samples comparing the control and probiotic groups determined by independent samples t-tests.
Figure 6
Figure 6
(A) PLS-DA score plot and (B) variable importance projection scores (VIP) comparing serum samples from the control and probiotic groups. Each dot in the PLS-DA score plot represents a serum sample at 8 weeks from each group. The directionality and influence of metabolites are depicted as a VIP score.
Figure 7
Figure 7
(A) Metabolic pathway analysis and (B) enrichment analysis of estimated enzyme activity of serum metabolites using MetaboAnalyst 6.0. The metabolic pathways are represented as circles according to their scores of enrichment (vertical axis, shade of red) and topology (pathway impact, horizontal axis, circle diameter). Enzyme enrichment is plotted as enrichment ratio, and more significant p-values are denoted by a darker shade of red.
Figure 8
Figure 8
Heatmap of the significant liver metabolites (p < 0.05) comparing the control and probiotic groups.
Figure 9
Figure 9
(A) PLS-DA score plot and (B) variable importance projection scores (VIP) comparing liver tissue samples from the control and probiotic groups. Each dot in the PLS-DA score plot represents a liver tissue sample at 8 weeks from each group. The directionality and influence of metabolites are depicted as a VIP score.
Figure 10
Figure 10
(A) Metabolic pathway analysis and (B) enrichment analysis of estimated enzyme activity of liver metabolites using MetaboAnalyst 6.0. The metabolic pathways are represented as circles according to their scores of enrichment (vertical axis, shade of red) and topology (pathway impact, horizontal axis, circle diameter). Enzyme enrichment is plotted as enrichment ratio, and more significant p-values are denoted by a darker shade of red.
Figure 11
Figure 11
The effects of the probiotic cocktail on (A) α-diversity and (B) β-diversity of the gut microbiome using 16S rRNA sequencing. DNA was extracted from mouse fecal matter that was collected from C57BL/6J mice after the eight-week study. Analyses were performed in FASTQ format using QIIME2. Comparisons were between the control and the probiotic group. The graphs are presented as mean ± std. ** p <0.01, * p < 0.05.

References

    1. Sun H., Saeedi P., Karuranga S., Pinkepank M., Ogurtsova K., Duncan B.B., Stein C., Basit A., Chan J.C., Mbanya J.C., et al. IDF Diabetes Atlas: Global, regional and country-level diabetes prevalence estimates for 2021 and projections for 2045. Diabetes Res. Clin. Pract. 2021;183:109119. doi: 10.1016/j.diabres.2021.109119. - DOI - PMC - PubMed
    1. Mouri M., Badireddy M. StatPearls. StatPearls Publishing; Treasure Island, FL, USA: 2023. Hyperglycemia. - PubMed
    1. Kianmehr H., Zhang P., Luo J., Guo J., Pavkov M.E., Bullard K.M., Gregg E.W., Ospina N.S., Fonseca V., Shi L., et al. Potential gains in life expectancy associated with achieving treatment goals in people with type 2 diabetes in the United States. JAMA Netw. Open. 2022;5:e227705. doi: 10.1001/jamanetworkopen.2022.7705. - DOI - PMC - PubMed
    1. Seshasai S.R.K., Kaptoge S., Thompson A., Angelantonio E.D., Gao P., Sarwar N., Whincup P.H., Mukamal K.J., Gillum R.F., Holme I., et al. Diabetes Mellitus, Fasting Glucose, and Risk of Cause-Specific Death. N. Engl. J. Med. 2011;364:829–841. doi: 10.1056/NEJMoa1008862. - DOI - PMC - PubMed
    1. Ojo O. Dietary Intake and Type 2 Diabetes. Nutrients. 2019;11:2177. doi: 10.3390/nu11092177. - DOI - PMC - PubMed

LinkOut - more resources