. 2025 Oct 21;13(10):1076.
doi: 10.3390/vaccines13101076.

Efficacy of a Novel PCV2d and Mycoplasma hyopneumoniae Combined Vaccine in Piglets with High and Low Levels of PCV2 Maternally Derived Antibodies at Vaccination

Affiliations

Efficacy of a Novel PCV2d and Mycoplasma hyopneumoniae Combined Vaccine in Piglets with High and Low Levels of PCV2 Maternally Derived Antibodies at Vaccination

Mònica Sagrera et al. Vaccines (Basel). .

Abstract

Background/Objectives: Maternally derived antibody (MDA) levels of porcine circovirus 2 (PCV2) may eventually interfere with humoral response and vaccination efficacy. This study aimed to evaluate the efficacy of a ready-to-use PCV2d and Mycoplasma hyopneumoniae combined vaccine in piglets with different PCV2 MDA levels at vaccination in an experimental inoculation with a heterologous viral genotype. Methods: Forty-eight piglets were allocated into vaccinated (V) and non-vaccinated (NV) groups with high (H) and low (L) PCV2 MDA subgroups (H-V, H-NV, L-V, L-NV). At 3 weeks of age, the piglets received either one dose of vaccine or placebo. Five weeks later, all animals were intranasally challenged with a PCV2b inoculum. Body weight was registered at different time points. Blood samples, peripheral blood mononuclear cells and tracheobronchial lymph nodes (TBLN) were collected and used to assess viraemia, viral load, humoral and cellular responses and histological lesions. Results: The V group showed higher PCV2 antibody levels from challenge onwards, along with a lower percentage of viraemic pigs and reduced viral load in serum at 2 and 3 weeks post-challenge (wpc) and in TBLN tissues compared to the NV group. The H-V group had the highest antibody levels post-challenge, showed no detectable viraemia and had a lower overall amount of virus in tissues. The NV group (especially H-NV) exhibited increased levels of IFN-γ, IFN-α and TNF-α post-challenge. Conclusions: The tested vaccine elicited humoral and cellular immune responses and reduced viral presence in serum and tissues, demonstrating efficacy in a PCV2 subclinical infection model despite high MDA levels at the time of vaccination. Understanding both humoral and cellular immune responses according to different MDA levels can help design more effective vaccination strategies against PCV2.

Keywords: cytokines; in situ hybridisation; maternally derived antibodies; porcine circovirus 2; quantitative PCR; vaccine.


Conflict of interest statement

Mònica Sagrera, Laura Garza-Moreno and David Espigares are employees of Ceva Salud Animal.

Figures

Figure A1
Figure A1
Pearson correlation coefficients between PCV2 antibody levels at vaccination and the Delta value from vaccination to 3 wpv (A,B), 3 to 5 wpv (C,D) and vaccination to 5 wpv (challenge) (E,F) for V animals, shown in red (A,C,E), and NV animals, shown in blue (B,D,F). * indicates a statistically significant correlation (p < 0.05). wpv: weeks post-vaccination; NV: not vaccinated; V: vaccinated.
Figure A2
Figure A2
Distribution of PCV2 qPCR results for individual animals in each experimental group (H-V in red, H-NV in dark blue, L-V in pink and L-NV in light blue) from 1 to 3 wpc, as well as in serum and in tissue supernatant from TBLNs. Each row represents an individual animal’s qPCR result, with columns indicating time points and TBLN results. The results are interpreted as follows: positive quantifiable (solid coloured), below the LOQ (checkered) and below the LOD (white). Black boxes indicate missing data of animals that died during this study. H: high; L: low; V: vaccinated; NV: not vaccinated; POS: positive; LOQ: limit of quantification; LOD: limit of detection; TBLN: tracheobronchial lymph node; wpc: weeks post-challenge.
Figure 1
Figure 1
Scheme of the study design. TBLN: tracheobronchial lymph node; wpv: weeks post-vaccination; wpc: weeks post-challenge.
Figure 2
Figure 2
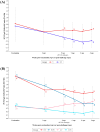
Mean (± SD) PCV2 IgG ELISA S/P ratio obtained at different time points between the V vs. NV (A) and the H-V, H-NV, L-V and L-NV (B) groups. Different letters in superscript indicate statistically significant differences between groups at each time point (p < 0.05). H: high; L: low; V: vaccinated; NV: not vaccinated; wpv: weeks post-vaccination; wpc: weeks post-challenge.
Figure 3
Figure 3
PCV2 qPCR results obtained in sera weekly after PCV2b challenge. (A) Percentage of positive samples in animals from V (in red) and NV (in blue) groups, shown as quantifiable (solid-coloured portion) and non-quantifiable or below the LOQ (checkered portion). (B) Mean (± SD) log10 PCV2 DNA copies/mL of serum for V (in red) and NV (in blue) groups. (C) Percentage of positive samples in animals from H-V (red), H-NV (dark blue), L-V (pink) and L-NV (light blue), shown as quantifiable (solid-coloured portion) and non-quantifiable or below the LOQ (checkered portion). (D) Mean (± SD) log10 PCV2 DNA copies/mL of serum for H-V (red), H-NV (dark blue), L-V (pink) and L-NV (light blue) groups. In subfigures (A,C), * indicates statistically significant differences between groups at each time point (p < 0.05), and ** indicate a trend towards statistical significance (p < 0.1). In subfigures (B,D), different superscript letters indicate statistically significant differences between groups in mean log10 PCV2 copies/mL at each time point (p < 0.05). PCV2: porcine circovirus 2; wpv: weeks post-vaccination; wpc: weeks post-challenge; H: high; L: low; NV: not vaccinated; V: vaccinated.
Figure 4
Figure 4
PCV2 qPCR results obtained in TBLN for (A) V (in red) vs. NV (in blue) and (B) H-V (red), H-NV (dark blue), L-V (pink) and L-NV (light blue) groups. Left Y axes indicate the percentage (in bars) of positive quantifiable (solid-coloured portion) and non-quantifiable (checkered portion) samples. Right Y axes refer to the mean log10 PCV2 DNA copies/mL of tissue supernatant (± SD), shown as individual dots. Different superscript letters indicate statistically significant differences in mean log10 PCV2 DNA copies/mL of tissue supernatant between groups (p < 0.05). PCV2: porcine circovirus 2; TBLN: tracheobronchial lymph node; H: high; L: low; V: vaccinated; NV: not vaccinated.
Figure 5
Figure 5
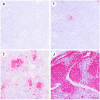
Representative images of the PCV2 in situ hybridisation (ISH) scoring system (0–3) from TBLNs. Each red dot represents a hybridisation signal indicating the presence of the PCV2 genome.
Figure 6
Figure 6
Boxplots showing the median (horizontal line) and mean (cross) values of PCV2-specific cytokine secretion (IFN-α, IFN-γ, TNF-α, IL-12, IL-4, IL-10, IL-1β and IL-6, labelled from (AH), respectively) (pg/mL) in PBMC supernatant samples from V and NV groups at different time points. * indicates statistically significant differences between groups for each time point (p < 0.05). ** indicate a trend towards statistical significance (p < 0.1). IFN: interferon; IL: interleukin; TNF: tumour necrosis factor; PCV2: porcine circovirus 2; NV: not vaccinated; V: vaccinated.
Figure 7
Figure 7
Boxplots showing the median (horizontal line) and mean (cross) values of PCV2-specific cytokine secretion (IFN-α, IFN-γ, TNF-α, IL-12, IL-4, IL-10, IL-1β and IL-6, labelled from (AH), respectively) (pg/mL) in PBMC supernatant samples from H-V, H-NV, L-V and L-NV groups at different time points. * indicates statistically significant differences between groups for each time point (p < 0.05). ** indicate a trend towards statistical significance (p < 0.1). IFN: interferon; IL: interleukin; TNF: tumour necrosis factor; PCV2: porcine circovirus 2; H: high; L: low; NV: not vaccinated; V: vaccinated.

References

    1. Alarcon P., Rushton J., Wieland B. Cost of post-weaning multi-systemic wasting syndrome and porcine circovirus type-2 subclinical infection in England-an economic disease model. Prev. Vet. Med. 2013;110:88–102. doi: 10.1016/j.prevetmed.2013.02.010. - DOI - PMC - PubMed
    1. Opriessnig T., Karuppannan A.K., Castro A.M.M.G., Xiao C.T. Porcine circoviruses: Current status, knowledge gaps and challenges. Virus Res. 2020;286:198044. doi: 10.1016/j.virusres.2020.198044. - DOI - PubMed
    1. Fablet C., Marois-Créhan C., Simon G., Grasland B., Jestin A., Kobisch M., Madec F., Rose N. Infectious agents associated with respiratory diseases in 125 farrow-to-finish pig herds: A cross-sectional study. Vet. Microbiol. 2012;157:152–163. doi: 10.1016/j.vetmic.2011.12.015. - DOI - PubMed
    1. Segalés J., Sibila M. Revisiting porcine circovirus disease diagnostic criteria in the current porcine circovirus 2 epidemiological context. Vet. Sci. 2022;9:110. doi: 10.3390/vetsci9030110. - DOI - PMC - PubMed
    1. Kristensen C.S., Baadsgaard N.P., Toft N. A meta-analysis comparing the effect of PCV2 vaccines on average daily weight gain and mortality rate in pigs from weaning to slaughter. Prev. Vet. Med. 2010;98:250–258. doi: 10.1016/j.prevetmed.2010.11.015. - DOI - PubMed

LinkOut - more resources