

Multiscale drought dataset for the Greater Antilles: a resource for environmental and adaptation studies
- PMID: 41152277
- PMCID: PMC12569196
- DOI: 10.1038/s41597-025-05992-9
Multiscale drought dataset for the Greater Antilles: a resource for environmental and adaptation studies
Abstract
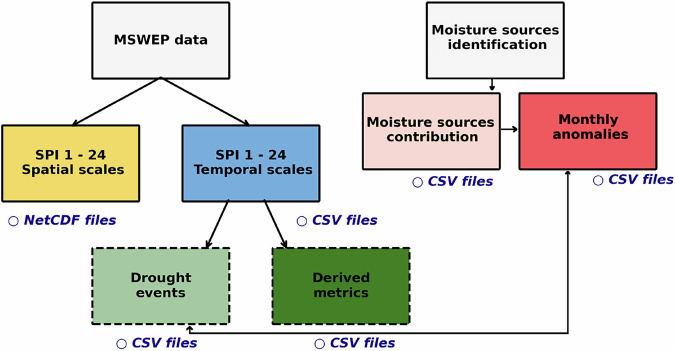
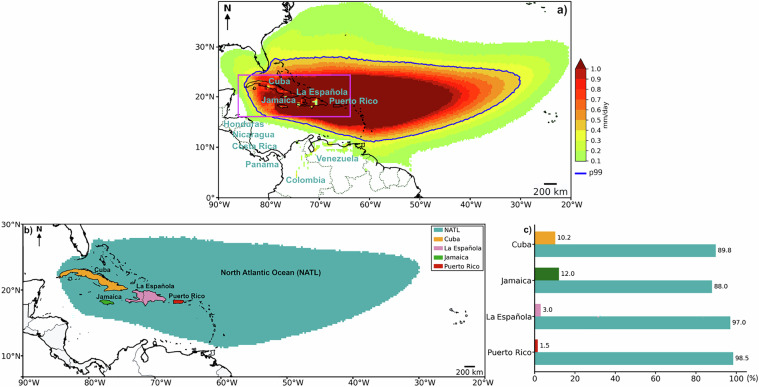
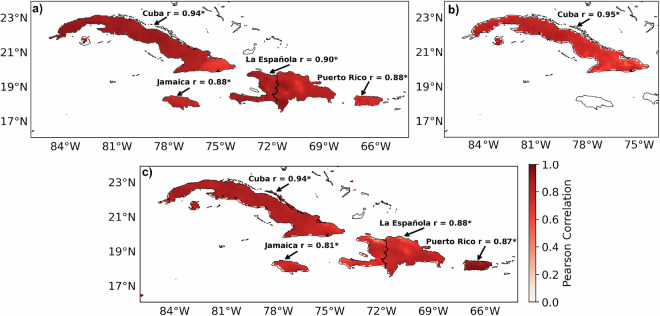
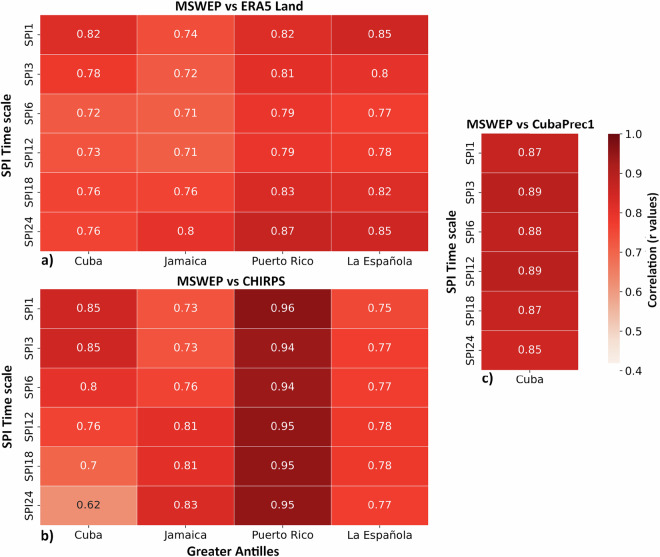
This study presents a multi-drought metric dataset based on the Standardized Precipitation Index (SPI) for the Greater Antilles, covering Cuba, Jamaica, Puerto Rico and La Española. The SPI was derived from high-resolution (0.1°) Multi-Source Weighted-Ensemble Precipitation (MSWEP) precipitation data for the 1980-2023 period. The MSWEP precipitation and SPI datasets were validated against observational and reanalysis datasets, providing good relationships. Temporal and spatial drought conditions were identified for the SPI temporal scales from 1 to 24 SPI temporal scales, while drought episodes were identified for 1, 3, 6, 12, 18 and 24 temporal scales, and characterised according to their duration, severity, affected area, persistence, onset speed, and recovery. A source-sink moisture analysis was also performed to support the attribution of dry conditions. We demonstrate possible uses of the database, and its consistency in representing past drought events that caused severe damage. Therefore, it proves to be a practical tool for understanding the phenomenon of drought in the Caribbean, managing water resources, agricultural development, and many other sectors.
© 2025. The Author(s).
Conflict of interest statement
Competing interests: The authors declare no competing interests.
Figures


References
-
- Dai, A. & Zhao, T. Uncertainties in historical changes and future projections of drought. Part I: estimates of historical drought changes. Clim. Change144, 519–533, 10.1007/s10584-016-1705-2 (2017).
-
- Van Loon, A. F. et al. Drought as a continuum – memory effects in interlinked hydrological, ecological, and social systems. Nat. Hazards Earth Syst. Sci.24, 3173–3205, 10.5194/nhess-24-3173-2024 (2024).
-
- Mycoo, M. et al. Small Islands. In: Climate Change 2022: Impacts, Adaptation and Vulnerability. Contribution of Working Group II to the Sixth Assessment Report of the Intergovernmental Panel on Climate Change (eds. Pörtner, H.-O. et al.) 2043–2121, 10.1017/9781009325844.017 (Cambridge Univ. Press, 2022).
-
- Taylor, M. A., Stephenson, T. S., Chen, A. A. & Stephenson, K. A. Climate Change and the Caribbean: Review and Response. Caribb. Stud.40, 169–200, https://revistas.upr.edu/index.php/csj/article/view/7201/5850 (2012).
-
- OECD/IDB. Caribbean Development Dynamics 2025. 10.1787/a8e79405-en (OECD Publishing, 2024).
LinkOut - more resources
Full Text Sources
Miscellaneous
