

Cold stress resilience in rice: genotypic variation, yield traits, and GGE biplot insights
- PMID: 41152354
- PMCID: PMC12569001
- DOI: 10.1038/s41598-025-21562-w
Cold stress resilience in rice: genotypic variation, yield traits, and GGE biplot insights
Abstract
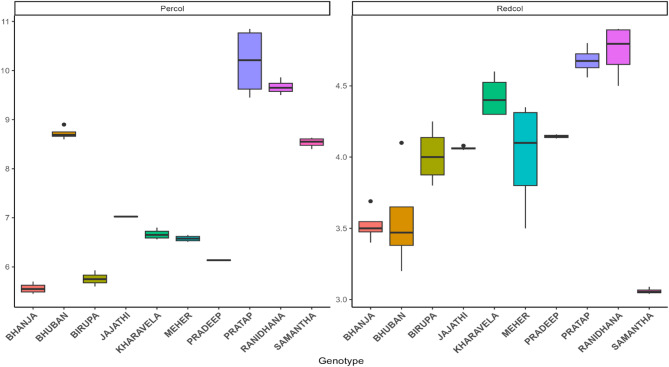
Rice (Oryza sativa L.), a staple food for over half of the global population, is highly sensitive to low temperatures, particularly during early growth stages, resulting in significant yield losses. Addressing cold stress during the early stages of rice cultivation by screening rice genotypes can ensure optimal crop establishment and subsequent growth. An experiment was carried out by selecting ten rice genotypes for evaluation for cold tolerance through laboratory-based germination assays followed by subsequent screening with respect to biometric and biochemical parameters. Meher exhibited the highest germination rate (95%) under cold stress conditions, while Jajati and Ranidhana showed minimal variation in germination (2-7%). PERCOL (Percentage of seeds with coleoptile superior to 5 mm) and REDCOL (Percentage of reduction in coleoptile length) values remained consistent for Jajati and Pradeep. Cold stress led to notable reductions in plant height (9.2-31.1%) and the number of productive tillers per plant (36.8-37.1%). Samanta and Birupa recorded the highest number of productive tillers under control and cold stress conditions, respectively. Panicle exsertion was marginally impacted in Ranidhana (2.9%) and substantial decline recorded in Meher (19.2%), highlighting genotype-specific resilience. Spikelet fertility and 100-seed weight declined by 5.2-7.2% and 15-18%, respectively, in Samanta, and Jajati. Seed yield per plant was highest in Birupa (12.25 g/plant) under cold stress conditions. GGE biplot analysis indicated Kharavela and Birupa as high yielders under control and cold stress, respectively. Highest proline (4.6 mg/g) and carbohydrate content (18.08%) were noted in Samanta. Ranidhana and Samanta resulted in stable yield across environments indicating broader adaptability.
Keywords: Cold stress; Genotype; PERCOL; REDCOL; Scoring; Tolerant.
© 2025. The Author(s).
Conflict of interest statement
Declarations. Competing interests: The authors declare no competing interests. Consent for publication: All the authors have provided informed consent for publication of the manuscript.
Figures


References
-
- Sen, S., Chakraborty, R. & Kalita, P. Rice—Not just a staple food: A comprehensive review on its phytochemicals and therapeutic potential. Trends Food Sci. Technol.97, 265–285. 10.1016/j.tifs.2020.01.022 (2020).
-
- Lone, J. A. et al. Cold tolerance at germination and seedling stages of rice: Methods of evaluation and characterization of thirty rice genotypes under stress conditions. Int. J. Curr. Microbiol. Appl. Sci.7, 1103–1109. 10.20546/ijcmas.2018.701.134 (2018).
-
- Ye, C. et al. Cold tolerance in rice varieties at different growth stages. Crop Pasture Sci.60, 328–338. 10.1071/CP08352 (2009).
-
- Dong, J. et al. Physiological and genome-wide gene expression analyses of cold-induced leaf rolling at the seedling stage in rice (Oryza sativa L.). Crop J.7, 431–443. 10.1016/j.cj.2019.03.002 (2019).
-
- Ndour, D. et al. Agro-morphological evaluation of rice (Oryza sativa L.) for seasonal adaptation in the Sahelian environment. Agronomy6, 8. 10.3390/agronomy6010008 (2016).
MeSH terms
LinkOut - more resources
Full Text Sources
