. 2025 Sep 26;16(10):1139.
doi: 10.3390/genes16101139.

Atad1 Is a Potential Candidate Gene for Prepulse Inhibition

Affiliations

Atad1 Is a Potential Candidate Gene for Prepulse Inhibition

Akhilesh K Bajpai et al. Genes (Basel). .

Abstract

Background/Objectives: Prepulse inhibition (PPI) is a robust, reproducible phenotype associated with schizophrenia and other psychiatric disorders. This study was carried out to identify gene(s) influencing PPI. Methods: We performed Quantitative Trait Locus (QTL) analysis of PPI in 59 strains from the BXD recombinant inbred (BXD RI) mouse family and used a 2-LOD region for candidate gene identification. Genes significantly correlated with the candidate gene were identified based on genetic, partial, and literature correlation, and were further studied through gene enrichment and protein-protein interaction analyses. Phenome-wide association study (PheWAS) and differential expression analyses of the candidate gene were performed using human data. Results: We identified one significant (GN Trait 11428) and two suggestive male-specific QTLs (GN Traits 11426 and 11427) on Chromosome 19 between 27 and 36 Mb with peak LRS values of 19.2 (-logP = 4.2), 14.4 (-logP = 3.1), and 13.3 (-logP = 2.9), respectively. Atad1, ATPase family, AAA domain containing 1 was identified as the strongest candidate for the male-specific PPI loci. Atad1 expression in BXDs is strongly cis-modulated in the nucleus accumbens (NAc, LRS = 26.5 (-logP = 5.7). Many of the Atad1-correlated genes in the NAc were enriched in neurotransmission-related categories. Protein-protein interaction analysis suggested that ATAD1 functions through its direct partners, GRIA2 and ASNA1. PheWAS revealed significant associations between Atad1 and psychiatric traits, including schizophrenia. Analysis of a human RNA-seq dataset revealed differential expression of Atad1 between schizophrenia patients and the control group. Conclusions: Collectively, our analyses support Atad1 as a potential candidate gene for PPI and suggest that this gene should be further investigated for its involvement in psychiatric disorders.

Keywords: Atad1; BXD RI strains; candidate gene; prepulse inhibition; schizophrenia.


Conflict of interest statement

Drs. Bajpai, Freels, Lu, and Cook reported no biomedical financial interests or potential conflicts of interest.

Figures
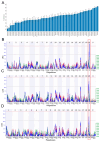
Figure 1
Figure 1
Genetic mapping for prepulse inhibition (PPI) percentage in BXD mice. (A) Bar plot showing %PPI in BXD mice at 85 dB. The x-axis shows the BXD strains, and the y-axis shows %PPI genomic loci mapped across all mouse chromosomes for %PPI at (B) 85 dB, (C) 70 dB, and (D) 80 dB, respectively, in male BXD mice. The x-axis indicates the genomic position, while the y-axis shows the LRS value, a measurement of the linkage between the % PPI and genomic region. One unit of LRS is equivalent to 4.61 units of “logarithm of the odds” (which is equal to −log10P likelihood ratio). The gray and red horizontal lines indicate suggestive and significant genome-wide thresholds, respectively. Suggestive QTLs were identified for % PPI at 70 and 80 dB, whereas a significant QTL was identified at 85 dB. The overlap of all the three QTLs on Chr 19 is shown with a red dotted box.
Figure 2
Figure 2
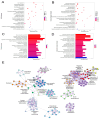
Functional enrichment analysis of Atad1-correlated genes. The genes correlated with Atad1 in NAc dataset were used as input in WebGestalt for enrichment analysis. Top 20 (A) KEGG pathways, (B) human phenotype ontologies (HPOs), (C) Gene Ontology biological processes (GO-BPs), and (D) mammalian phenotype ontologies (MPOs), respectively. The top 20 GO-BPs and MPOs presented here are significant with an FDR p-value < 0.001. A complete list of functional annotations is provided in Supplementary Table S1. (E) The correlated genes were uploaded into the Metscape tool to analyze the network of GO-BPs. Metascape employs a heuristic algorithm to select the most informative terms from the GO clusters obtained. More specifically, it samples the 20 top-score clusters, selects up to 10 of the best-scoring terms (lowest p-values) within each cluster, then connects all term pairs with Kappa similarity above 0.3. The nodes represent enriched GO-BP terms and are colored by their cluster IDs. The edges link similar terms. The most significant term of the cluster is displayed as a label to represent that cluster.
Figure 3
Figure 3
Correlation of prepulse inhibition (PPI) traits in male BXD mice with archived Atad1 expression in nucleus accumbens (NAc). % PPI at (A) 70 dB, (B) 80 dB, and (C) 85 dB is significantly negatively correlated with Atad1 expression. Correlation R and p-values are indicated in the figures. (DF): Atad1 expression difference between the “low” and “high” PPI BXD strains. The p-value based on Student’s t-test is shown above each plot. More details on traits can be found by querying GeneNetwork with the trait identifiers.
Figure 4
Figure 4
Protein–protein interaction network analysis of Atad1-correlated genes in the NAc dataset. (A) The protein–protein interaction network of all Atad1-correlated genes (global network). The network contains 1124 proteins (nodes/dots) and 3507 edges (interactions/lines). The network shows a high number of interactions among Atad1-correlated genes. (B) The top 10 nodes based on degree (number of interacting partners). (C) Protein–protein interaction network showing primary and secondary interactors of Atad1 (extracted from the global network presented in “panel A”). The Atad1 protein is indicated with a red border; its direct/primary interactors, Asna1 and Gria2, are indicated with black borders; and its secondary interactors, Eed and Dlg4, which have a high node degree in the global network (panel B), are indicated with yellow borders.
Figure 5
Figure 5
PheWAS analysis for Atad1. This analysis utilizes the Atad1 genomic region to find its associations with phenotypes measured in GWAS datasets. The PheWAS tool within GWASatlas (https://atlas.ctglab.nl/PheWAS, accessed on 15 May 2025) was used for this analysis.
Figure 6
Figure 6
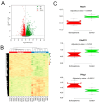
Validation of candidate genes identified in BXD mice using schizophrenia patient RNA-seq data. (A,B) Volcano plot and heatmap showing significant differential expression of genes between schizophrenia patients and controls. (C) Box plots indicating the expression of candidate genes in patient and control groups.

References

    1. Regier D., Narrow W.E., Rae D.S., Manderscheid R.W., Locke B.Z., Goodwin F.K. The de facto mental and addictive disorders service system. Epidemiologic catchment area prospective 1-year prevalence rates of disorders and services. Arch. Gen. Psychiatry. 1993;50:85–94. doi: 10.1001/archpsyc.1993.01820140007001. - DOI - PubMed
    1. Vawter M.P., Mamdani F., Macciardi F. An integrative functional genomics approach for discovering biomarkers in schizophrenia. Brief. Funct. Genom. 2011;10:387–399. doi: 10.1093/bfgp/elr036. - DOI - PMC - PubMed
    1. American Psychiatric Association What Is Schizophrenia. 2018. [(accessed on 13 April 2018)]. Available online: https://www.psychiatry.org/patients-families/schizophrenia/what-is-schiz....
    1. Crowley J.J., Sakamoto K. Psychiatric Genomics: Outlook for 2015 and challenges for 2020. Curr. Opin. Behav. Sci. 2015;2:102–107. doi: 10.1016/j.cobeha.2014.12.005. - DOI
    1. Schizophrenia Working Group of the Psychiatric Genomics Consortium Biological insights from 108 schizophrenia-associated genetic loci. Nature. 2014;511:421–427. doi: 10.1038/nature13595. - DOI - PMC - PubMed

Substances

LinkOut - more resources