. 2025 Oct 13;26(20):9954.
doi: 10.3390/ijms26209954.

Precision Profiling of Disease Progression in Murine Models of Sepsis and Septic Shock

Affiliations

Precision Profiling of Disease Progression in Murine Models of Sepsis and Septic Shock

Stewart D Ramsay et al. Int J Mol Sci. .

Abstract

Septic shock has an unacceptably high mortality rate and unmet need for new therapeutics. Murine models are crucial for research, yet methodologies often differ. This study characterised standard- and high-grade caecal ligation and puncture (CLP) murine models of septic shock by integrating ultraminiature arterial telemetry with comprehensive plasma biomarker analysis. Standard-grade and high-grade CLP was performed in 8-10 week old, male C57BL/6 mice (n = 98), with a subset implanted with arterial telemetry to monitor real-time circulatory function. Plasma markers of inflammation and organ damage were measured at multiple intervals up to 168 h post-CLP. Standard-grade and high-grade CLP showed distinct progressions; episodes of hypotension began 5-6 h after CLP in 30% of standard-grade and all high-grade CLP mice, with respective 168 h mortality of 40% and 71%. Recurrent episodes of hypotension 5-39 h after CLP were universally lethal. The coincidence of hypotension and elevated plasma lactate defined the onset of septic shock after high-grade CLP, which was always lethal. Inflammatory cytokines and markers of liver, renal, and cardiac damage were markedly elevated to 168 h after high-grade CLP, in contrast to standard-grade CLP, which returned to baseline by 48 h. Elevated plasma IL-6, TNFα, and corticosterone, along with reduced albumin, were significantly correlated with mortality. In conclusion, this research refines murine CLP models by providing a precise, dynamic map of the progression to septic shock. The high-grade CLP model consistently models early and late-stage physiological deterioration and serves as a robust model for evaluating the efficacy of novel therapies aimed at human septic shock.

Keywords: sepsis; septic shock; telemetry.


Conflict of interest statement

The authors declare no conflicts of interest.

Figures

Figure 1
Figure 1
Survival, weight change, and morbidity of CLP mice. (A) 168 h Kaplan–Meier survival curve of male C57BL/6 mice subject to standard- (n = 10) or high-grade CLP (n = 28). (B) Weight change % following standard- and high-grade CLP. (C) Cumulative disease index score following standard- and high-grade CLP (high score indicates high morbidity). Data are presented as mean ± SEM; * p ≤ 0.05.
Figure 2
Figure 2
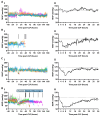
Real-time mean arterial pressure (MAP) in standard- and high-grade CLP. (A) MAP (mmHg) in standard-grade CLP survivors over (i) 168 h (each colour represents a mouse) and (ii) mean MAP in the first 36 h after CLP (n = 6). (B) MAP in standard-grade CLP non-survivors over (i) 168 h and (ii) mean MAP over the first 36 h (n = 4; vertical inset lines indicate death time). (C) MAP in high-grade CLP survivors (n = 12) over (i) 168 h and (ii) mean MAP in the first 36 h (n = 4). (D) MAP in high-grade CLP non-survivors over (i) 168 h and (ii) mean MAP in the first 36 h (n = 8). Horizontal dotted line depicts the 120 mmHg median MAP in the 48 h prior to CLP (n = 22).
Figure 3
Figure 3
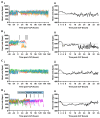
Real-time heart rate in standard- and high-grade CLP mice. (A) Heart rate (bpm) in standard-grade CLP survivors over (i) 168 h (each colour represents a mouse) and (ii) mean heart rate in the first 36 h after CLP (n = 6). (B) Heart rate in standard-grade CLP non-survivors over (i) 168 h and (ii) mean heart rate in the first 36 h (n = 4; vertical inset line indicates a death). (C) Heart rate in high-grade CLP survivors fitted with telemetry (n = 12/28) over (i) 168 h and (ii) mean heart rate in the first 36 h (n = 4). (D) Heart rate in high-grade CLP non-survivors over (i) 168 h and (ii) mean heart rate in the first 36 h (n = 8). Horizontal dotted line depicts the median heart rate (590 bpm) in the 48 h prior to CLP (n = 22).
Figure 4
Figure 4
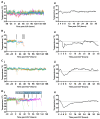
Real-time core temperature in standard- and high-grade CLP mice. (A) Core temperature (°C) in standard-grade CLP survivors over (i) 168 h (each colour represents a mouse) and (ii) mean temperature in the first 36 h after CLP (n = 6). (B) Core temperature in standard-grade CLP non-survivors over (i) 168 h and (ii) mean temperature in the first 36 h (n = 4; vertical inset line indicates a death). (C) Core temperature in high-grade CLP survivors fitted with telemetry (n = 12/28) over (i) 168 h and (ii) mean temperature in the first 36 h (n = 4). (D) Core temperature in high-grade CLP non-survivors over (i) 168 h and (ii) mean temperature in the first 36 h (n = 8). Horizontal dotted line depicts the median core temperature (37 °C) in the 48 h prior to CLP (n = 22).
Figure 5
Figure 5
Plasma cytokine responses in standard- and high-grade CLP mice. Plasma (A) interleukin (IL)-6 (ng/mL), (B) IL-10 (ng/mL), (C) macrophage inflammatory protein-2 (MIP-2; ng/mL), and (D) tumour necrosis factor alpha (TNFα; pg/mL) concentrations at 6, 12, 24, 48, 96, and 168 h after standard- and high-grade CLP (n = 6 per time point). Horizontal grey bar depicts the diurnal range of each cytokine measured in unoperated control mice (n = 24). Data are presented as mean ± SEM; * p ≤ 0.05.
Figure 6
Figure 6
Plasma lactate, albumin, and total corticosterone in standard- and high-grade CLP mice. Plasma (A) lactate (nmol), (B) albumin (mg/mL), and (C) total corticosterone (ng/mL) concentrations at 6, 12, 24, 48, 96, and 168 h after standard- and high-grade CLP (n = 6 per time point). Horizontal grey bar depicts the diurnal range of individual plasma markers measured in unoperated control mice (n = 24). Data are presented as mean ± SEM; * p ≤ 0.05.
Figure 7
Figure 7
Plasma markers of organ damage in standard- and high-grade CLP mice. Plasma (A) cystatin C (ng/mL), (B) troponin I (ng/mL), (C) aspartate transaminase (AST; pg/mL), and (D) alanine transaminase (ALT; pg/mL) concentrations at 6, 12, 24, 48, 96, and 168 h after standard- and high-grade CLP (n = 6 per time point). Horizontal grey bar depicts the diurnal range of individual damage marker measured in unoperated control mice (n = 24). Data are presented as mean ± SEM; * p ≤ 0.05.
Figure 8
Figure 8
Heat map summary of telemetry and plasma biomarker progression following CLP. Blue indicates low reading (telemetry) or plasma marker levels; red indicates low reading (telemetry) or plasma marker levels; black indicates normal physiological range. MAP, mean arterial pressure; HR, heart rate; ALT, alanine aminotransferase. Note: The blue shades for telemetry data from 40 h onwards denote progression to septic shock.
Figure 9
Figure 9
Caecal ligation and puncture (CLP) procedure. (A) Mouse caecum depicting ligation lengths and puncture/s related to standard (blue) and high-grade (green) CLP. (B) In-operative and 168 h post-operative image of high-grade CLP.

References

    1. Cecconi M.E.L., Levy M., Rhodes A. Sepsis and septic shock. Lancet. 2018;7:13. doi: 10.1016/S0140-6736(18)30696-2. - DOI - PubMed
    1. Srzic I., Nesek Adam V., Tunjic Pejak D. Sepsis Definition: What’s New in the Treatment Guidelines. Acta Clin. Croat. 2022;61((Suppl. S1)):67–72. doi: 10.20471/acc.2022.61.s1.11. - DOI - PMC - PubMed
    1. Chousterman B.G., Swirski F.K., Weber G.F. Cytokine storm and sepsis disease pathogenesis. Semin. Immunopathol. 2017;39:517–528. doi: 10.1007/s00281-017-0639-8. - DOI - PubMed
    1. Singer M., Deutschman C.S., Seymour C.W., Shankar-Hari M., Annane D., Bauer M., Bellomo R., Bernard G.R., Chiche J.-D., Coopersmith C.M., et al. The Third International Consensus Definitions for Sepsis and Septic Shock (Sepsis-3) JAMA. 2016;315:801–810. doi: 10.1001/jama.2016.0287. - DOI - PMC - PubMed
    1. Finfer S., Bellomo R., Lipman J., French C., Dobb G., Myburgh J. Adult-population incidence of severe sepsis in Australian and New Zealand intensive care units. Intensive Care Med. 2004;30:589–596. doi: 10.1007/s00134-004-2157-0. Erratum in Intensive Care Med. 2004, 30, 1252. - DOI - PubMed

Grants and funding

LinkOut - more resources