. 2025 Oct 16;26(20):10072.
doi: 10.3390/ijms262010072.

Neurofibromin Encoded by the Neurofibromatosis Type 1 (NF1) Gene Promotes the Membrane Translocation of SPRED2, Thereby Inhibiting the ERK Pathway in Breast Cancer Cells

Affiliations

Neurofibromin Encoded by the Neurofibromatosis Type 1 (NF1) Gene Promotes the Membrane Translocation of SPRED2, Thereby Inhibiting the ERK Pathway in Breast Cancer Cells

Nang Thee Su Pwint et al. Int J Mol Sci. .

Abstract

Neurofibromin (NF) inhibits the RAS/RAF/ERK pathway through its interaction with SPRED1 (Sprouty-related EVH1 domain-containing protein 1). Here, we investigated the functional relationship between NF and SPRED2 in breast cancer (BC). Human BC cell lines were transfected to downregulate or overexpress NF and SPRED2 and subsequently subjected to functional assays. Protein and mRNA levels were analyzed by Western blotting and RT-qPCR, respectively. Protein-protein interactions were examined by immunoprecipitation. Database analyses and immunohistochemistry (IHC) of BC tissues were performed to validate the in vitro findings. Downregulating NF or SPRED2 expression in BC cells enhanced cell proliferation, migration and invasion accompanied by RAF/ERK activation, whereas overexpression produced opposite effects. NF formed a protein complex with SPRED2 and facilitated its translocation to the plasma membrane. By IHC, SPRED2 membrane localization was absent in NF-negative luminal A and triple-negative BC (TNBC) but present in a subset of luminal A BC. By database analyses, both NF1 and SPRED2 mRNA levels were reduced in BC tissues, and luminal A BC patients with high expression of both NF1 and SPRED2 mRNA exhibited improved relapse-free survival. These results suggest a critical role for the NF-SPRED2 axis in BC progression and highlight it as a potential therapeutic target.

Keywords: RAS/RAF/ERK; SPRED2; breast cancer; neurofibromatosis type 1; neurofibromin.


Conflict of interest statement

The authors declare no conflicts of interest.

Figures

Figure 1
Figure 1
Expression of NF and SPRED2 in human breast cancer cell lines. (A) Normalized RNA-seq expression values of NF1 (left) and SPRED2 (right) were obtained from CCLE breast cancer cell lines. Raw read counts were processed in R (v3.36) using the edgeR package (version 3.36) with trimmed mean of M-values normalization and transformed to log2 counts per million. Cell lines are ranked in descending order of expression. Dot size and color indicate normalized expression levels. The cell lines selected for subsequent experiments are highlighted by blue boxes. (B) Cell lysates were prepared from the indicated cell lines, and NF and SPRED2 protein expression were assessed by Western blotting. Representative images from three independent experiments are shown.
Figure 2
Figure 2
NF negatively regulates BC cell proliferation, migration, and invasiveness. NF was knocked down (NF-KD) or overexpressed (NF-OE) in HCC1937 and MCF7 cells. (A) Cell proliferation was evaluated by MTT assay in each cell line. (B) Cell lysates were prepared from control (Ctrl), NF-KD and NF-OE cells, and cyclin D1 expression was analyzed by Western blotting. Representative images are shown on the left, and the band intensities were quantified and semi-quantitated from three independent experiments on the right. Cyclin D1 expression levels were normalized to GAPDH. (C) Cell migration and invasion assays were performed using HCC1937 cells. Representative images are shown on the left (scale bars: 100 μm). For quantification, cells in three randomly selected low-power fields (20× magnification) per membrane were counted (three independent experiments). (D) Scratch assays were performed using MCF7 cells. Representative images captured with an inverted microscope are shown on the left (scale bars: 100 μm). The wound gap distance was measured at the indicated time points using Image J software (v1.54f) (three independent experiments). * p < 0.05, ** p < 0.01, **** p < 0.0001 (two-tailed unpaired t-test).
Figure 3
Figure 3
SPRED2 negatively regulates cancer cell proliferation, migration, and invasiveness. SPRED2 was knocked down (SP2-KD) or overexpressed (SP2-OE) in HCC1937 and MCF7 cells. (A) Cell proliferation was evaluated by MTT assay in each cell line. (B) Cell lysates were prepared from control (Ctrl), SP2-KD and SP2-OE cells, and cyclin D1 expression was analyzed by Western blotting. Representative images are shown on the left, and band intensities were quantified and semi-quantitated from three independent experiments on the right. Cyclin D1 expression levels were normalized to GAPDH. (C) Cell migration and invasion assays were performed using HCC1937 cells. Representative images are shown on the left (scale bars: 100 μm). For quantification, cells in three randomly selected low-power fields (20× magnification) per membrane were counted (three independent experiments). (D) Scratch assays were performed using MCF7 cells. Representative images captured with an inverted microscope are shown on the left (scale bars: 100 μm). The wound gap distance was measured at the indicated time points using Image J software (three independent experiments). * p < 0.05, ** p < 0.01, **** p < 0.0001 (two-tailed unpaired t-test).
Figure 4
Figure 4
NF negatively regulates ERK and RAF activation. NF was knocked down (NF-KD) or overexpressed (NF-OE) in HCC1937 and MCF7 cells. ERK and RAF phosphorylation in HCC1937 cells (A) and MCF7 cells (B) were analyzed by Western blotting. Representative images are shown on the left, and band intensities were quantified and semi-quantitated from three independent experiments on the right. * p < 0.05, ** p < 0.01 (two-tailed unpaired t-test).
Figure 5
Figure 5
Interaction between NF and SPRED2 in BC cells. (AC) NF was knocked down (NF-KD) or overexpressed (NF-OE) in HCC1937 and MCF7 cells. Cell lysates were prepared, and the protein expression of NF and SPRED2 was analyzed by Western blotting. Representative images are shown on the left, and band intensities were quantified and semi-quantitated from three independent experiments on the right. (D) Cell lysates (1 mg) from HCC1937 and MCF7 cells were incubated with anti-NF or anti-SPRED2 antibody. The immunoprecipitated proteins were separated by SDS-PAGE and analyzed by Western blotting using anti-SPRED2 or anti-NF antibody, respectively. Representative images are shown. * p < 0.05 (two-tailed unpaired t-test).
Figure 6
Figure 6
NF promotes the membrane translocation of SPRED2. (AC) NF was knocked down (NF-KD) or overexpressed (NF-OE) in HCC1937 and MCF7 cells by transfection with control siRNA (Ctrl) or NF-specific siRNA, and with control plasmid (Ctrl) or NF-overexpression plasmid, respectively. (A) SPRED2 localization in HCC1937 (left) and MCF7 (right) cells were examined by immunofluorescence using a confocal microscope. Representative images are shown (scale bars: 10 μm). (B,C) Cytoplasmic, nuclear, and membrane protein fractions were isolated from the HCC1937 (B) and MCF7 (C) cells. The expression of each protein was analyzed by Western blotting. Representative images are shown in the upper panels, and band intensities were quantified and semi-quantitated from three independent experiments in the lower panels. * p < 0.05, ** p < 0.01 (two-tailed unpaired t-test).
Figure 7
Figure 7
Expression of NF and SPRED2 in BC tissues. A total of 94 invasive BC tissue specimens were stained with anti-NF or anti-SPRED2 antibodies. Representative images of NF (A) and SPRED2 (B) staining are shown (original magnification, 400×). (A) NF expression was classified based on staining intensity as negative, low, or high. (B) SPRED2 staining was categorized as negative, cytoplasm positive (C+), membrane negative (M−), or membrane positive (M+). Scale bars: 50 μm.
Figure 8
Figure 8
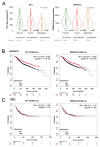
Database analysis of NF1 and SPRED2 mRNA expression and their prognostic value in BC. (A) NF1 and SPRED2 mRNA expression levels in normal breast tissues, primary breast cancer tissues, and metastatic tissues were obtained from TNMplot. Statistical significance was assessed using Dunn’s multiple comparison test. (B,C) The prognostic significance of NF1 and SPRED2 mRNA expression in invasive luminal A BC (B) and TNBC (C) were evaluated using Kaplan–Meier Plotter. A log-rank p-value < 0.05 was considered statistically significant.

References

    1. Bray F., Laversanne M., Sung H., Ferlay J., Siegel R.L., Soerjomataram I., Jemal A. Global cancer statistics 2022: GLOBOCAN estimates of incidence and mortality worldwide for 36 cancers in 185 countries. CA Cancer J. Clin. 2024;74:229–263. doi: 10.3322/caac.21834. - DOI - PubMed
    1. Siegel R.L., Kratzer T.B., Giaquinto A.N., Sung H., Jemal A. Cancer statistics, 2025. CA Cancer J. Clin. 2025;75:10–45. doi: 10.3322/caac.21871. - DOI - PMC - PubMed
    1. Zagami P., Carey L.A. Triple negative breast cancer: Pitfalls and progress. NPJ Breast Cancer. 2022;8:95. doi: 10.1038/s41523-022-00468-0. - DOI - PMC - PubMed
    1. Peduto C., Zanobio M., Nigro V., Perrotta S., Piluso G., Santoro C. Neurofibromatosis Type 1: Pediatric Aspects and Review of Genotype-Phenotype Correlations. Cancers. 2023;15:1217. doi: 10.3390/cancers15041217. - DOI - PMC - PubMed
    1. Maani N., Westergard S., Yang J., Scaranelo A.M., Telesca S., Thain E., Schachter N.F., McCuaig J.M., Kim R.H. NF1 Patients Receiving Breast Cancer Screening: Insights from The Ontario High Risk Breast Screening Program. Cancers. 2019;11:707. doi: 10.3390/cancers11050707. - DOI - PMC - PubMed