Review
. 2025 Oct 29:19714009251387297.
doi: 10.1177/19714009251387297. Online ahead of print.

Beyond ASPECTS: A Practical Guide to CT Perfusion Interpretation

Affiliations
Review

Beyond ASPECTS: A Practical Guide to CT Perfusion Interpretation

Raphael Miller et al. Neuroradiol J. .

Abstract

Computed tomography perfusion (CTP) imaging plays a pivotal role in the early evaluation of patients presenting with acute ischemic stroke (AIS), particularly by identifying candidates for endovascular thrombectomy. Accurate interpretation of CTP requires a structured approach that integrates technical understanding, clinical judgment, and recognition of the modality's limitations. This review was prompted by real clinical challenges faced by the senior author and aims to provide both a theoretical foundation and practical guidance for interpreting CTP. Key concepts are illustrated through real clinical scenarios and corresponding annotated images. In addition to reviewing current AHA/ASA guidelines, we discuss institutional best practices and highlight challenging clinical scenarios in which CTP can significantly influence treatment decisions. This article aims to equip clinicians with the knowledge and tools needed for consistent and effective use of CTP.

Keywords: CT perfusion; Neuroradiology; RAPID; acute ischemic stroke; mechanical thrombectomy.


Conflict of interest statement

The authors declared no potential conflicts of interest with respect to the research, authorship, and/or publication of this article.

Figures

Figure 1.
Figure 1.
This patient presented with a left MCA occlusion. No contrast is seen in the left MCA on arterial phase (left); however, there is late filling of the left MCA territory on capillary phase (right) due to circuitous leptomeningeal collateralization to perfuse the left MCA territory, as the rest of the arteries have already washed out. In fact, there was continued delayed bolus arrival in this territory well into the venous phase (not shown). This explains why Tmax is elevated in the left MCA territory.
Figure 2.
Figure 2.
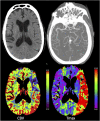
In this patient, there is increased CBV in the left frontoparietal lobe and decreased CBV in the left posterior basal ganglia (left). The region of increased CBV is associated with Tmax elevation (right) and corresponds to the penumbra, while the region of decreased CBV represents the core infarct. Penumbral increase in CBV is attributable to autoregulatory mechanisms, however, CBV can also be normal in the penumbra. By contrast, CBV is always decreased in the core infarct.
Figure 3.
Figure 3.
A large field of view that includes the torcula Herophili and as much supratentorial brain as possible and excludes the ocular lens is selected for scanning.
Figure 4.
Figure 4.
Contrast reflux (left) as a result of the left brachiocephalic vein being pinched off between the aorta and manubrium (right). The contrast bolus is stretched, and the CTA/CTP image is degraded. Injecting contrast through a right upper extremity vein circumvents this problem.
Figure 5.
Figure 5.
Summary of CT perfusion interpretation workflow.
Figure 6.
Figure 6.
Perfusion parameter colormaps are generated by postprocessing software, in this case demonstrating decreased CBF (revealing hypoperfusion state; top left), decreased CBV (corresponding to core infarct volume; top right), and increased Tmax (corresponding to total critical hypoperfused tissue volume; bottom left) in the left MCA territory. An associated DWI image (bottom right) localized the infarct to the left gangliocapsular region with decreased CBV.
Figure 7.
Figure 7.
Motion artifact due to head motion near the end of the scan leading to global perfusion artifact.
Figure 8.
Figure 8.
Sufficient length of acquisition time is essential for ensuring that the time-attenuation graph is captured until a new baseline is established. Compare sufficient length (left) to insufficient length (right). Note that the new baseline is nonzero due to the recirculation of contrast.
Figure 9.
Figure 9.
Global cerebral artifact on CBF and Tmax due to poor AIF and VOF. Note the faulty TOF curve with lack of normal AIF and VOF curves, generating abnormal appearing colormaps (top). After reprocessing on another software, a normal appearing TOF curve was generated along with diagnostic appearing CBV, CBF, and Tmax color maps (bottom).
Figure 10.
Figure 10.
CTP postprocessing software provides volumetric data for ischemic penumbra and core infarct, along with color coded corresponding images. The core infarct (purple) is defined by neuronal death with irreversible loss of function, corresponding to area of restricted diffusion and rCBF on CTP <30% (per RAPID). The penumbra (yellow) is defined by ischemic but salvageable tissue which corresponds to the difference between the volume of core infarct and the volume of critically hypoperfused tissue (green; defined by RAPID as Tmax > 6 s).
Figure 11.
Figure 11.
In this patient presenting with acute left MCA syndrome, the non-contrast CT (top left) was negative, but the concurrent CTA demonstrated a distal left M1 occlusion (top right). CT perfusion demonstrated a small region of core infarct (i.e., decreased CBV) in the left frontoparietal lobe (bottom left) surrounded by a much larger region of critically hypoperfused tissue (i.e., increased Tmax) (bottom right), a mismatch that indicates a large salvageable penumbra.
Figure 12.
Figure 12.
There is a small infarct at the left caudate nucleus (red arrow) and a larger infarct in the left fronto-insular and anterior gangliocapsular regions (blue arrow) on head CT that are not reported in the CTP findings (left). The smaller infarct is likely not detected by RAPID because its size is below the resolution of quantitative analysis, while the larger infarct, corresponding to an area of increased Tmax (>6 s), is likely masked on CTP due to delayed recruitment of collateral vessels.
Figure 13.
Figure 13.
There is a large right MCA territory infarction seen on non-contrast CT (right) performed after right M1 reperfusion. However, on CTP this appears as a much smaller region of core infarct on the rCBV map (bottom left). This is because reperfusion has allowed for contrast to recirculate in the right M1 territory, masking the underlying, irreversible tissue infarction. Moreover, there is luxury perfusion of the right operculum and basal ganglia (corresponding to elevated rCBF), superimposed on and obscuring a large portion of the infarct on the CBF colormap. These findings underscore the importance of reviewing the non-contrast head CT alongside CTP findings.
Figure 14.
Figure 14.
Bilateral chronic frontal infarcts (left) are not included in CBF (middle) or Tmax color maps (right) due to automatic exclusion of chronic infarcts that approach density of CSF by RAPID algorithm.
Figure 15.
Figure 15.
CTP performed in the early time window before 6 h of last known well demonstrates a large core infarct. Post thrombectomy (L ICA occlusion) MRI was normal (not shown), indicating ghost core infarct.
Figure 16.
Figure 16.
This patient presented with left upper extremity weakness for 3 days and exam was notable for right gaze preference and left upper extremity numbness. There is a subocclusive thrombus in the right distal M1. It is difficult to appreciate on the CTA (bottom right), but perfusional alterations are readily appreciated on CTP (top right). Digital subtraction angiography (DSA) images before (bottom left) and after successful TICI 3 embolectomy (bottom center) are included as well.
Figure 17.
Figure 17.
Large right sided Tmax prolongation (right) due to chronic right ICA occlusion (red arrow) in a patient with moyamoya. The patient was asymptomatic. This can sometimes be seen with chronic steno-occlusive disease and doesn’t mean that the patient will develop an infarct in this area. The only way to estimate future infarct risk in this setting is with a cerebrovascular reserve study.
Figure 18.
Figure 18.
There is a right M1 occlusion seen on CTA (left) with only small and scattered areas of corresponding Tmax elevation (right). An acute occlusion would more likely present as larger MCA territory Tmax prolongation, increasing diagnostic confidence that this represents chronic steno-occlusive disease.
Figure 19.
Figure 19.
This patient has a large right M1 infarct, to which the patient’s clinical presentation was initially attributed. However, there is also critical hypoperfusion with elevated Tmax >6 s in the right ACA territory (left), leading the interpreting radiologist to reexamine the CTA and identify the MeVO involving a branch of the right ACA (right).
Figure 20.
Figure 20.
This patient had a subtle left inferior M2 MeVO that was difficult to appreciate on CTA (left) but perfusional alterations were readily appreciated on CTP (right).
Figure 21.
Figure 21.
There is an acute infarct in the left gangliocapsular area (right). In this same region, the CBF is elevated and Tmax is decreased (left), consistent with hyperperfusion related to luxury perfusion.
Figure 22.
Figure 22.
Ictal/post-ictal hyperperfusion in the left MCA/PCA territory in the setting of Todd’s paralysis. Incidentally noted is evidence of prior left temporal lobectomy. Importantly, there is a cortically based region of CBF/CBV elevation in the left temporal occipital MCA/PCA territory that demonstrates washed-out cortical veins on SWI (bottom right image). The latter is likely due to relatively decreased deoxyhemoglobin in this region due to periictal hyperperfusion out of proportion to metabolic demand.

References

    1. Albers GW, Marks MP, Kemp S, et al. Thrombectomy for stroke at 6 to 16 hours with selection by perfusion imaging. N Engl J Med 2018; 378: 708–718. - PMC - PubMed
    1. Nogueira RG, Jadhav AP, Haussen DC, et al. Thrombectomy 6 to 24 hours after stroke with a mismatch between deficit and infarct. N Engl J Med 2018; 378: 11–21. - PubMed
    1. Chung KJ, Danny DS, Lee T-Y. Quantitative functional imaging with CT perfusion: technical considerations, Kinetic modeling, and applications. Frontiers in Physics; 11, Epub ahead of print 19 December 2023. 10.3389/fphy.2023.1246973 - DOI
    1. Kasasbeh AS, Christensen S, Straka M, et al. Optimal computed tomographic perfusion scan duration for assessment of acute stroke lesion volumes. Stroke 2016; 47: 2966–2971. - PMC - PubMed
    1. RapidAI FAQ. RapidAI frequently asked questions. Rapidai.com. https://www.rapidai.com/faq accessed 31 July 2025.

LinkOut - more resources