. 2025 Oct;646(8087):1069-1074.
doi: 10.1038/s41586-025-09630-7. Epub 2025 Oct 29.

Building wet planets through high-pressure magma-hydrogen reactions

Affiliations

Building wet planets through high-pressure magma-hydrogen reactions

H W Horn et al. Nature. 2025 Oct.

Abstract

Close-in transiting sub-Neptunes are abundant in our Galaxy1. Planetary interior models based on their observed radius-mass relationship suggest that sub-Neptunes contain a discernible amount of either hydrogen (dry planets) or water (wet planets) blanketing a core composed of rocks and metal2. Water-rich sub-Neptunes have been believed to form farther from the star and then migrate inwards to their present orbits3. Here we report experimental evidence of reactions between warm, dense hydrogen fluid and silicate melt that release silicon from the magma to form alloys and hydrides at high pressures. We found that oxygen liberated from the silicate melt reacts with hydrogen, producing an appreciable amount of water up to a few tens of weight per cent, which is much greater than previously predicted based on low-pressure ideal gas extrapolation4,5. Consequently, these reactions can generate a spectrum of water contents in hydrogen-rich planets, with the potential to reach water-rich compositions for some sub-Neptunes, implying an evolutionary relationship between hydrogen-rich and water-rich planets. Therefore, detection of a large amount of water in exoplanet atmospheres may not be the optimal evidence for planet migration in the protoplanetary disk, calling into question the assumed link between composition and planet formation location.


Conflict of interest statement

Competing interests: The authors declare no competing interests.

Figures

Fig. 1
Fig. 1. Laser-heated diamond-anvil cell experiments on silicate melts in a hydrogen medium.
a, Schematic of the experimental setup. The spacers (small single grains of the same material from which the foil was made) separate the sample foil from diamond anvils, which allow hydrogen to surround the sample. During laser heating (the red area at the centre) of the silicate sample, hydrogen penetrated the grain boundaries of the sample foil and immediately above and below were heated by thermal conduction. b, An SEM image of two laser-heated areas of a fayalite sample. FAY-1 was heated at 6 GPa and 3,017 K and FAY-3 was heated at 11 GPa and 2,898 K. The spheres at the centre of the heated areas are Fe-rich alloys formed by hydrogen–silicate reaction. c, An SEM image of FAY-3 from an angle for a wider area. d, Raman-active OH vibration from H2O ice after heating silica + Fe metal in a hydrogen medium at 14 GPa. A full two-dimensional Raman map of the heated area is shown in Extended Data Fig. 3c. Scale bars, 5 μm (b,c).
Fig. 2
Fig. 2. XRD patterns after heating silicate samples in a hydrogen medium.
a, In run SCO-3, olivine breaks down to Fe metal alloys and MgO. b, In run FAY-1, fayalite breaks down with Fe and Si present as metal alloys. A very small amount of body-centred cubic (bcc) Fe may exist. c, Heating to temperatures below melting (2,725–3,197 K), bridgmanite (bdm) and ferropericlase (fp) appear at 42 GPa (SCO-13a). d, When the bdm + fp were melted (3,352–3,924 K at 42 GPa), bdm mostly breaks down and B2 Fe1−ySiy appears (run SCO-13b). X-ray energy is 30 keV for b and 37 keV for a, c and d. The ticks below the diffraction patterns are the peak positions of the observed phases. fcc, face-centred cubic; dhcp, double hexagonal close-packed; Ol, San Carlos olivine starting material; Fa, fayalite starting material.
Fig. 3
Fig. 3. Water redistribution in a 5ME planet with 10 wt% envelope made of H2 and He.
a, Water mass fraction (Z) for an initial state distribution (black) and after 100 Myr of evolution (red). Mixing efficiency decreases as the planet cools (left to right). b, The schematic shows the time progression of the mixing scale near the reaction zone. Source data
Extended Data Fig. 1
Extended Data Fig. 1. Pressure-temperature conditions of the experimental runs.
a, San Carlos olivine, b, fayalite, and c, silica starting materials in this study (Extended Data Table 1). For fayalite, three experimental runs were conducted with a 50% Ar + 50% H2 medium (open circles). Melting curves for the relevant phases are shown: FeHx (ref. ); Mg2SiO4 (ref. ); Fe2SiO4 (ref. ); SiO2 (ref. ). All the experiments were conducted above the melting temperature of hydrogen. While olivine and fayalite couple with laser beams sufficiently well for melting, lack of Fe in silica makes it difficult to heat above melting as shown in c.
Extended Data Fig. 2
Extended Data Fig. 2. Thermal evolution of a rocky 5 ME sub-Neptune planet with an H + He (5 wt%) envelope.
Shown is the temperature (color) as a function of pressure (y-axis) in the interior from the center up to 1 bar pressure, as a function of time (x-axis). The range of pressure (dotted black) and temperature (solid black) in which water production is expected according to the experiments is shown. The red dashed line signifies the mantle-envelope interface. Model is based on ref. .
Extended Data Fig. 3
Extended Data Fig. 3. Analysis of the samples after heating in a hydrogen medium in LHDAC.
Two dimensional maps of the XRD intensities of a, silicates and b, B2 Fe1→ySiy after heating the sample in SCO-11. The anti-correlation between the two at the heating spot center (dashed circle) shows that when melted silicates (bdm) break down, Si is reduced to form Fe1→ySiy. c, Raman-active OH vibration from H2O ice after heating silica + Fe metal. The Raman spectra were measured for a 20 × 20 µm2 heated area. The distance between the spots where the spectra were collected is 5 µm. The spectra were collected after laser heating at 14 GPa.
Extended Data Fig. 4
Extended Data Fig. 4. Raman spectra from run FAY-8 where starting fayalite was heated to 1550 K at 14 GPa.
The measurements were conducted after temperature quench to 300 K and decompression to 2.5 GPa. The Si–H vibrational mode was detected at the melted area (a). No such feature was observed outside the melted area (blue, b). In b, we also include spectrum measured at the melted spot (red) for the same exposure time. The same mode has been documented for silica melted in hydrogen at 2–3 GPa (ref. ).
Extended Data Fig. 5
Extended Data Fig. 5. X-ray diffraction pattern measured after heating a starting mixture of San Carlos olivine and Fe metal to 2534 K at 21 GPa (run SCO-7).
The ticks below the diffraction pattern are the peak positions of the observed phases. The names of the phases in the legend is ordered same as the ticks from top to bottom. X-ray energy is 37 keV.
Extended Data Fig. 6
Extended Data Fig. 6. X-ray diffraction pattern measured after heating a silica starting material in a hydrogen medium to 2899 K (below the melting temperature) at 14 GPa (run SIL-2).
The ticks below the diffraction pattern are the peak positions of the observed phases. The names of the phases in the legend is ordered same as the ticks from top to bottom. X-ray energy is 37 keV.
Extended Data Fig. 7
Extended Data Fig. 7. Atomic volume (left) and volume increase by H incorporation, V (right), of FeHx observed in different runs (colored symbols).
The volumes were measured after heating at 300 K. For comparison, the figures also include data points from previous studies. The equations of state for fcc Fe (H/Fe = 0) and fcc FeH (H/Fe = 1) are from ref. and ref. , respectively. The data points measured for the solid phases quenched from (Fe,Ni)-H liquid are shown as black symbols. The concentration curves (x) shown in the right figure are from the density functional theory calculation in ref. .
Extended Data Fig. 8
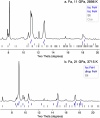
Extended Data Fig. 8. X-ray diffraction pattern measured after heating a fayalite starting material in a hydrogen medium to a, 2898 K at 11 GPa (run FAY-3) and b, 3715 K at 21 GPa (run FAY-5).
a was measured at 6 µm away from the heating center. Two separate fcc phases with different volumes (and therefore different levels of hydrogenation) are observed, likely because of different rate of temperature decrease during quenching at different spots and loss of hydrogen during quench of FeHx melt. The ticks below the diffraction patterns are the peak positions of the observed phases. The names of the phases in the legend is ordered same as the ticks from top to bottom. X-ray energy is a, 30 keV and b, 37 keV.
Extended Data Fig. 9
Extended Data Fig. 9. X-ray diffraction pattern measured after the decompression of a fayalite starting material heated in a hydrogen medium to 3017 K at 6 GPa (run FAY-1).
The diffraction pattern was measured at 1 bar and 300 K. The ticks below the diffraction pattern are the peak positions of the observed phases. The names of the phases in the legend is ordered same as the ticks from top to bottom. “*” indicates a feature from detector defects. X-ray energy is 37 keV.

References

    1. Fulton, B. J. et al. The California-Kepler survey. III. A gap in the radius distribution of small planets. Astron. J.154, 109 (2017).
    1. Bean, J. L., Raymond, S. N. & Owen, J. E. The nature and origins of sub-Neptune size planets. J. Geophys. Res. Planets126, e2020JE006639 (2021). - PMC - PubMed
    1. Bitsch, B. et al. Dry or water world? How the water contents of inner sub-Neptunes constrain giant planet formation and the location of the water ice line. Astron. Astrophys.649, L5 (2021).
    1. Misener, W., Schlichting, H. E. & Young, E. D. Atmospheres as windows into sub-Neptune interiors: coupled chemistry and structure of hydrogen–silane–water envelopes. Mon. Not. R. Astron. Soc.524, 981–992 (2023).
    1. Schlichting, H. E. & Young, E. D. Chemical equilibrium between cores, mantles, and atmospheres of super-Earths and sub-Neptunes and implications for their compositions, interiors, and evolution. Planet. Sci. J.3, 127 (2022).

LinkOut - more resources