. 2025 Nov;27(11):e70193.
doi: 10.1111/1462-2920.70193.

The Microbial Trojan Horse and Antimicrobial Resistance: Acanthamoeba as an Environmental Reservoir for Multidrug Resistant Bacteria

Affiliations

The Microbial Trojan Horse and Antimicrobial Resistance: Acanthamoeba as an Environmental Reservoir for Multidrug Resistant Bacteria

Ronnie Mooney et al. Environ Microbiol. 2025 Nov.

Abstract

Antimicrobial resistance (AMR) is shaped by environmental pressures, yet the role of microbial predators such as Acanthamoeba in resistance dynamics remains poorly characterized. In this study, Acanthamoeba-associated bacterial communities (AAB) exhibited significantly higher multidrug resistance than sediment-associated bacterial communities (SAB) in a polluted estuarine system. All isolated amoebae belonged to the T4 genotype, suggesting selection for resilient host organisms. AAB displayed elevated multiple antibiotic resistance (MAR) indices and increased resistance to multiple antibiotic classes, particularly aminoglycosides, macrolides, fluoroquinolones and β-lactams. Correlation analysis revealed that resistance in AAB, but not SAB, was associated with potentially toxic elements (PTEs) known to influence phagocyte survival, including arsenic, vanadium, and calcium. These elements may select for traits that confer metal and antibiotic resistance. The findings support a model where protists act as selective environments for AMR, favoring bacteria that possess enhanced tolerance mechanisms. This work provides the first direct evidence linking PTE exposure to the intracellular resistome of Acanthamoeba-associated bacteria. It underscores the need for AMR monitoring frameworks that include protist-bacteria interactions, with implications for One Health and environmental risk assessment strategies. Moreover, this approach is scalable for application in low/middle-income countries, where AMR burden is greatest and surveillance capacity remains limited.

Keywords: Acanthamoeba; Symbiosis; antimicrobial resistance; intracellular; microbiome; potentially toxic elements.


Conflict of interest statement

The authors declare no conflicts of interest.

Figures

FIGURE 1
FIGURE 1
Vashi Creek with sample sites used in this study highlighted (Sites 1–8).
FIGURE 2
FIGURE 2
Evolutionary lineage of Acanthamoeba isolates from Vashi Creek (highlighted in bold) generated using the ASA.S1 region of the 18S rRNA gene and screened against publicly available sequences (NCBI). All isolates clustered most closely with those from the T4 genotype (highlighted blue), while other genotypes (highlighted green) were not represented in our isolates. Lesser related amoebae were highlighted in pink (Protoacanthamoeba) and red (Entamoeba) and similar regions of the 18S gene used for comparison.
FIGURE 3
FIGURE 3
Antibiotic susceptibility of sediment‐associated isolates (a) versus Acanthamoeba‐associated isolates (b) across all sites (1–8). Bacteria showing resistance to none of the antibiotics tested are shown in pink, those resistant to only 1 antibiotic are shown in yellow, and those resistant to multiple antibiotics are shown in orange. p < 0.05 denoted by ‘*‘, p < 0.0001 denoted by ‘ǂ’.
FIGURE 4
FIGURE 4
The influence of sediment‐ or Acanthamoeba‐association on resistance. Pink nodes represent antibiotics; ampicillin (AMP), azithromycin (AZM), chloramphenicol (CHL), ciprofloxacin (CIP), enrofloxacin (ENR), erythromycin (ERY), linezolid (LIN), oxacillin (OXA), streptomycin (STR), sulfamethazine (SUL), sulfamethoxazole/trimethoprim (SXT), tetracycline (TET). Orange node represents sediment‐associated bacteria (SAB), blue node represents Acanthamoeba‐associated bacteria (AAB), edges denote significant correlations (r > 0.4), edge colour represents the type of correlation (Green = positive, Red = negative), edge values represent the correlation coefficient (r). Influence of bacterial association on resistance for all antibiotics is summarised (right of grey dividing line; SAB = orange circle, AAB = blue circle, No clear influence = white circle).
FIGURE 5
FIGURE 5
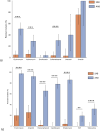
Percent of sediment‐ (orange bars) and Acanthamoeba‐associated bacteria (blue bars) resistant to screened antibiotics selected on (a) LB agar; n = 162; 83 SAB, 79 AAB and (b) cetrimide agar; n = 129; 51 SAB, 78 AAB. Isolates were screened in triplicate. Data are percent of isolates resistant from respective conditions SAB or AAB. Error bars denote 95% confidence interval (Wilson method), significance denoted by ‘**’ for p < 0.01, ‘***’ for p < 0.001 and ‘****’ for p < 0.0001 as determined by Fisher's exact test.
FIGURE 6
FIGURE 6
Average multiple antibiotic (MAR) index for isolates selected for on LB agar, cetrimide agar, and combined data from both LB and cetrimide agar conditions. This plot illustrates the distribution of bacterial MAR index in sediment‐associated bacterial communities (SAB; orange) and Acanthamoeba‐associated bacterial communities (AAB; blue). The shaded shapes illustrate the spread and relative frequency of values, where greater width indicates a higher density of isolates with that MAR index. The median is denoted by a white cross, the shaded box shows the interquartile range. Individual points are overlaid to display the underlying data. Sample sizes: SAB (n = 83, 51, 134), AAB (n = 79, 78, and 157). Significance denoted by ‘****’ for p < 0.0001 as determined by the Mann–Whitney U test.
FIGURE 7
FIGURE 7
Radar plot summarising correlations of potentially toxic elements (PTEs) with antibiotic resistance in sediment‐associated (SAB; orange) and Acanthamoeba‐associated bacterial communities (AAB; blue). Correlations were weighted and stabilised using Fisher's z transformation, and values were back‐transformed to r for interpretation. Axes represent individual PTEs, with the plotted lines showing the overall strength of association for SAB and AAB. PTEs: Aluminium (Al), arsenic (As), calcium (Ca), cadmium (Cd), cobalt (Co), chromium (Cr), copper (Cu), iron (Fe), magnesium (Mg), manganese (Mn), nickel (Ni), lead (Pb), vanadium (V) and zinc (Zn).

References

    1. Aa, S. , Gnanappazham L., Muraleedharan K. R., et al. 2022. “Multi‐Decadal Changes of Mangrove Forest and Its Response to the Tidal Dynamics of Thane Creek, Mumbai.” Journal of Sea Research 180: 102162. 10.1016/j.seares.2021.102162. - DOI
    1. Abd‐El‐Aziz, A. S. , Agatemor C., and Etkin N.. 2017. “Antimicrobial Resistance Challenged With Metal‐Based Antimicrobial Macromolecules.” Biomaterials 118: 27–50. 10.1016/j.biomaterials.2016.12.002. - DOI - PubMed
    1. Acar Kirit, H. , Bollback J. P., and Lagator M.. 2022. “The Role of the Environment in Horizontal Gene Transfer.” Molecular Biology and Evolution 39: 39. 10.1093/molbev/msac220. - DOI - PMC - PubMed
    1. Aendekerk, S. , Ghysels B., Cornelis P., and Baysse C.. 2002. “Characterization of a New Efflux Pump, MexGHI‐OpmD, From Pseudomonas aeruginosa That Confers Resistance to Vanadium.” Microbiology 148: 2371–2381. 10.1099/00221287-148-8-2371. - DOI - PubMed
    1. Ahmad, I. 2022. “Environmental Biofilms as Reservoir of Antibiotic Resistance and Hotspot for Genetic Exchange in Bacteria.” In Beta‐Lactam Resistance in Gram‐Negative Bacteria, 237–265. Springer Nature Singapore.

MeSH terms

Substances

LinkOut - more resources