. 2025 Oct 30:14:RP104530.
doi: 10.7554/eLife.104530.

Dissociation of the nuclear basket triggers chromosome loss in aging yeast

Affiliations

Dissociation of the nuclear basket triggers chromosome loss in aging yeast

Mihailo Mirkovic et al. Elife. .

Abstract

In many organisms, aging is a clear risk factor for chromosome missegregation, the main source of aneuploidy. Here, we report that old yeast cells lose chromosomes by partitioning them asymmetrically to their daughter cells together with the pre-existing (old) spindle pole body (SPB, centrosome equivalent in yeast). Strikingly, remodelling of the nuclear pore complex (NPC) and the displacement of its nuclear basket triggered these asymmetric chromosome segregation events. Simultaneously, nuclear basket displacement caused unspliced pre-mRNAs to leak into the cytoplasm. We show that removing the introns of three genes involved in chromosome segregation was sufficient to fully suppress chromosome loss in old cells. Promoting pre-mRNA leakage in young cells also caused asymmetric chromosome partitioning and loss through the same three introns. Therefore, we propose that basket displacement from NPCs and its consequences for pre-mRNA quality control are key triggers of aging phenotypes such as aneuploidy.

Keywords: NPC; RNA; S. cerevisiae; aging; aneuploidy; cell biology; chromosomes; gene expression; intron; mitosis.


Conflict of interest statement

MM, JM, AM, JP, SL, SE, YB No competing interests declared

Figures
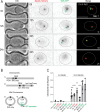
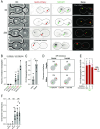
Figure 1.
Figure 1.. Old cells lose chromosomes.
(A) Cells carrying labeled chromosome II (Chr II) and imaged at different ages on the microfluidic chip. Time of acquisition is indicated on the left. Fluorescent markers are indicated on top. Replicative age of imaged cells (completed budding event – CBE) is indicated in merged images. Scale bar (upper right panel) is 5 µm. Green arrow marks the TetR-GFP foci. (B) Schematic representation of the chromosome and minichromosome labels used in this study. (C) Chromosome loss frequency of indicated chromosomes after 0 hr (~0–3 CBE) and 24 hr (~18–22 CBE) of imaging. The mode of chromosome visualization is indicated in parenthesis, i.e., TetR-GFP (green), TetR-mCherry (red), or mini-chromosome encoded GFP (GFP exp). Chromosome loss is defined as the absence of the label in the mother cell in G1 shortly after the final cell cycle, or the final anaphase. Each data point represents frequency of chromosome loss in a cohort of ~50 cells. Unpaired t-test (*<0.05, **<0.005, ***<0.0005). Mean value ± SD.
Figure 1—figure supplement 1.
Figure 1—figure supplement 1.. Introns affect chromosome loss, but not whole nuclei missegregation in aging.
(A) Stills of a whole nuclear missegregation event, with both spindle pole bodies (SPBs) ending up in the daughter cell.Scale bar (upper right panel) is 5 µm. (B) Quantification of the frequency of whole nuclear missegregation events in wt and 3 x∆i (n=450 cells, cohorts of 50 cells, Unpaired t-test).Mean value ± SD.
Figure 2.
Figure 2.. Old cells lose chromosomes by asymmetric sister chromatid partitioning.
(A) Images of anaphase cells carrying the labeled chromosome II as in Figure 1A. Red arrows mark the old spindle pole bodies (SPBs).Scale bar (upper right panel) is 5 µm. (B) Frequency of anaphase missegregation events where chromosomes are visible only in the mother or daughter cell (n>150) Bars are labeled as in Figure 1C. Each data point represents frequency of anaphase missegregation in the cohort of ~50 anaphases. Mean value ± SD. (C) Fraction of anaphase missegregation events that lead to TetR-GFP foci being present only in mother or daughter cell (n=66, cohorts of 10). Mean value ± SD. (D) Graphical schematic of all observed anaphase missegregation events and their frequency. (E) Fraction of anaphase missegregation events biased towards the old (red) or new SPB (pink) for mini-chromosome (n=30) and Chr II with normal (Daughter (D)) and inverted segregation of the old SPB (Mother (M)) (n=60 and 30). Cohorts of 10–20 missegregating anaphases. Mean value ± SD. (F) Frequency of chromosome II loss in wt, Ipl1-321, at 0 hr (~0–3 completed budding event, CBE), 12 hr (~8–12 CBE), and 24 hr (~18–22 CBE) at 27 °C. Each data point represents loss frequency in a cohort of ~50 cells. Unpaired t-test (*<0.05, **<0.005, ***<0.0005).Mean value ± SD.
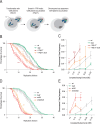
Figure 2—figure supplement 1.
Figure 2—figure supplement 1.. Aging sensitizes cells to mild Ipl1 inhibition.
(A) Replicative lifespan of wt, GLC7∆i, Ipl1-321 and Ipl1-321 GLC7∆i cells grown at 27 Celsius (n=300), Log-rank (Mantel--Cox) test *<0.05,**<0.005,***<0.0005. (B) Frequency of chromosome II loss in wt, Ipl1-321, Ipl1-321 3xΔi (GLC7-∆i MCM21-∆i NBL1∆i) at 0 hr (~0–3 completed budding event, CBE), 12 hr (~8–12 CBE), and 24 hr (~18–22 CBE) at 27 °C. Each data point represents loss frequency in a cohort of ~50 cells. Unpaired t-test (*<0.05, **<0.005).Mean value ± SD.
Figure 3.
Figure 3.. extrachromosomal rDNA circle (ERC) formation and nuclear pore complex (NPC) remodeling drive chromosome loss and aging.
(A) Chromosome II loss frequency per completed budding event (CBE) in strains of indicated genotype (divided into categories of 5xCBE) (N, n(cells/divisions) wt=458/8600, sir2∆=158/1779, fob1∆=127/2681, sgf73∆=142/3950 mlp1∆=302/4270). Loss frequencies in the same age category are compared to wt. Unpaired t-test (*<0.05, **<0.005, ***<0.0005). Mean value ± SEM (B) Replicative lifespan of listed genotypes (n>120 cells, Log-rank (Mantel--Cox) test *<0.05, **<0.005, ***<0.0005).
Figure 3—figure supplement 1.
Figure 3—figure supplement 1.. The effect of introns on chromosome loss is not chromosome-specific.
(A) Replicative lifespan of wt, mad1∆, mad2∆ cells. n>100 cells, Log-rank (Mantel-Cox) test. (B) Frequency of chromosome II, IV, and GFP minichromosome loss (See Figure 1B) in wt and upon removal of intron of GLC7 at 24 hr (~18–22 completed budding event, CBE). Each data point represents a fraction of loss in a cohort of ~50 cells. Unpaired t-test (*<0.05, **<0.005, ***<0.0005).Mean value ± SD.
Figure 4.
Figure 4.. Introns drive asymmetric chromatid partitioning and chromosome loss in aging.
(A) A list of genes encoding kinetochore-associated proteins adapted from Biggins, 2013 . Intron-containing genes are marked in red. (B) Chromosome II loss frequency at indicated aging time (top) in cells of indicated genotype. 3xΔi stands for GLC7-∆i MCM21-∆i NBL1-∆i triple mutant. Each data point represents the frequency of chromosome loss in a cohort of ~50 cells. Unpaired t-test (*<0.05, **<0.005, ***<0.0005). Mean value ± SD. (C) Frequency of anaphase missegregation of chromosome II at indicated aging time (top) in cells of indicated genotype. 3xΔi stands for GLC7-∆i MCM21-∆i NBL1-∆i triple mutant. Each data point represents missegregation frequency in a cohort of ~50 anaphases. Loss frequencies in the same age category are compared to wt. Unpaired t-test (*<0.05, **<0.005, ***<0.0005). Mean value ± SD. (D) Replicative lifespan upon intron removal (n>200 cells, Log-rank (Mantel--Cox) test, *<0.05, **<0.005, ***<0.0005).
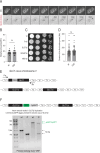
Figure 4—figure supplement 1.
Figure 4—figure supplement 1.. The 3x Δiremoval does not alter mitotic timing, growth or budding in old age due to GLC7∆i duplication.
(A) Stills depicting the method of mitotic timing quantification in young cells, measuring the time between spindle pole body (SPB) alignment and SPB separation, marking anaphase onset.Scale bar (upper left panel) is 5 µm. (B) Mitotic timing in wt and 3xΔi cells (n>50, unpaired t-test).Mean value ± SD. (C) 10-fold serial dilution spot assay for different intron removal strains. YPD, two days of growth, 30 °C. (D) Measuring the timing between the emergence of the bud and cytokinesis in the final completed division of the replicative lifespan in wt and 3xΔi cells (n>50, unpaired t-test). Mean value ± SD. (E) Map of the GLC7 locus on chromosome V, the flanking Ty1 elements, and the result of Ty1 transposition. (F) The result of tagging the duplicated locus with C-terminal ye-GFP tag. Upon tagging the GLC7-∆i but not the wt GLC7 locus, the locus duplication becomes evident (Thermo Scientific O’Gene Ruler 1kb DNA was used as a ladder).
Figure 5.
Figure 5.. Basket displacement causes intron-dependent chromosome loss in young and old cells.
(A) Stills of symmetric and asymmetric anaphases in young cells. Arrow marks the old spindle pole body (SPB). Scale bar (upper right panel) is 5 µm. (B) Frequency of anaphase missegregation of chromosome II in cells of indicated genotypes (n>2500 cells). Each data point represents anaphase missegregation frequency in a cohort of >300 cells. Mean value ± SD. (C) Fraction of chromosome II missegregation with old (red) or new SPB (pink) in anaphase cells of indicated genotype (n=30 cohorts of ~10 missegregation events) Unpaired t-test (*<0.05, **<0.005, ***<0.0005). Mean value ± SD. (D) Chromosome II loss frequency in indicated genotype as a function of CBE (categories of 5xCBE) (N, n(cells/divisions) wt=458/8600, mlp1∆=302/4270,3 x∆i=469/9974 mlp1∆ 3 x∆i=295/4757).Mean value ± SEM. (E) Replicative lifespan of listed genotypes. Red and green stars represent p-values between the wt and the corresponding genotype. Black stars represent the p-value between mlp1∆ and mlp1∆ 3 x∆i (n>300 cells, Log-rank (Mantel--Cox) test, *<0.05, **<0.005, ***<0.0005).
Figure 6.
Figure 6.. Non-centromeric DNA is sufficient to drive aging and chromosome loss.
(A) Schematic of transformation of chromosome II reporter strains with YRp17 (-CEN plasmid) and the accumulation of non-centromeric plasmids. (B) Replicative lifespan of strains with and without YRp17 plasmid. Red stars represent p-values between the YRp17 and YRp17 3 x∆i strain. Orange stars represent the p-value between YRp17 3 x∆i and wt (n>200 cells, Log-rank (Mantel--Cox) test, *<0.05, **<0.005, ***<0.0005). (C) Chromosome II loss frequency in indicated genotypes as a function of completed budding event (CBE) (divided into categories of 5xCBE) (N, n(cells/divisions) wt=458/8600, 3 x∆i=469/9974, +YRp17=199,2097, +YRp17 3 x∆i=200,3134). Mean value ± SEM. (D) Replicative lifespan of sir2Δ and sir2Δ3x∆i strain. Stars represent p-value between sir2Δ and sir2Δ3x∆i (n>200 cells, Log-rank (Mantel-Cox) test, *<0.05, **<0.005, ***<0.0005). (E) Chromosome II loss frequency in indicated genotype as a function of CBE (divided into categories of 5xCBE) (N, n(cells/divisions) wt=458/8600, 3 x∆i=469/9974, sir2Δ=351,3500, sir2Δ3x∆i=350,3840). Mean value ± SEM.
Figure 7.
Figure 7.. Pre-mRNA leaks to the cytoplasm of old cells.
(A) Images of RNA fluorescence in situ hybridization (RNA FISH) targeting three long introns (GLC7, YRA1, DBP2) in young and old cells.Scale bar (upper left panel) is 5 µm. (B) Quantification of GLC7 intron RNA FISH foci localization in young and old cells (n=295, cohorts of ~100 cells). Mean value ± SD. (C) Principle of the pre-mRNA translation reporter (left panel) adapted from Sorenson and Stevens, 2014. (D) Images of the pre-mRNA translation reporter in cells (right panel) of indicated genotype (top) at indicated ages (bottom).Scale bar (upper left panel) is 5 µm. (E) Ratio of mCherry/GFP signal in the same cells at 0 hr and after 24 hr of aging. 119/146 cells have a ratio greater than ‘1.’ (F) Log2 ratio of mCherry/GFP in cells of indicated genotype as a function of age, normalized to wt median at 0 hr (n=60, 35, 32). Unpaired t-test comparing mCherry/GFP intensity of cells at 12 or 24 hr (*<0.05, **<0.005, ***<0.0005).Mean value ± SD.
Figure 7—figure supplement 1.
Figure 7—figure supplement 1.. Single molecule RNA fluorescence in situ hybridization (smRNA FISH) probes are intron-specific.
(A) Images of smRNA FISH experiments in wt and GLC7-∆i cells.Scale bar (uper left panel) is 5 µm. (B) Quantification of smRNA FISH foci per cell in wt and GLC7-∆i cells. (C) Quantification of smRNA FISH foci per cell in wt cells at 0 and 28 hr of aging (n>300, cohorts of 100+ cells).Mean value ± SD.
Figure 8.
Figure 8.. Pre-mRNA leakage is sufficient to drive asymmetric chromatid partitioning.
(A) Chromosome II missegregation in cells of indicated genotypes (n=2774, 3000, 5269, 2650, 1607). Each data point represents anaphase missegregation frequency in the cohort of >300 cells. Mean value ± SD. (B) Fraction of chromosome II missegregation with old (red) or new spindle pole body (SPB) (pink) in anaphase cells of indicated genotype (n=50,30 cohorts of ~10 missegregation events). Unpaired t-test (*<0.05, **<0.005, ***<0.0005).Mean value ± SD.

Update of

  • doi: 10.1101/2024.10.31.621394
  • doi: 10.7554/eLife.104530.1
  • doi: 10.7554/eLife.104530.2

Comment in

  • doi: 10.7554/eLife.109320

References

    1. Adusumalli S, Ngian ZK, Lin WQ, Benoukraf T, Ong CT. Increased intron retention is a post-transcriptional signature associated with progressive aging and Alzheimer’s disease. Aging Cell. 2019;18:e12928. doi: 10.1111/acel.12928. - DOI - PMC - PubMed
    1. Baldi S, Bolognesi A, Meinema AC, Barral Y. Heat stress promotes longevity in budding yeast by relaxing the confinement of age-promoting factors in the mother cell. eLife. 2017;6:e28329. doi: 10.7554/eLife.28329. - DOI - PMC - PubMed
    1. Biggins S, Severin FF, Bhalla N, Sassoon I, Hyman AA, Murray AW. The conserved protein kinase Ipl1 regulates microtubule binding to kinetochores in budding yeast. Genes & Development. 1999;13:532–544. doi: 10.1101/gad.13.5.532. - DOI - PMC - PubMed
    1. Biggins S. The composition, functions, and regulation of the budding yeast kinetochore. Genetics. 2013;194:817–846. doi: 10.1534/genetics.112.145276. - DOI - PMC - PubMed
    1. Bitterman KJ, Medvedik O, Sinclair DA. Longevity regulation in Saccharomyces cerevisiae: linking metabolism, genome stability, and heterochromatin. Microbiology and Molecular Biology Reviews. 2003;67:376–399. doi: 10.1128/MMBR.67.3.376-399.2003. - DOI - PMC - PubMed

MeSH terms

Substances

LinkOut - more resources