. 2025 Oct 30;16(1):9586.
doi: 10.1038/s41467-025-64850-9.

Characterizing social behavior relevant for infectious disease transmission in four low- and middle-income countries, 2021-2023

Affiliations

Characterizing social behavior relevant for infectious disease transmission in four low- and middle-income countries, 2021-2023

Kristin N Nelson et al. Nat Commun. .

Abstract

Infectious diseases account for nearly half of all child mortality worldwide, with most of the burden concentrated in low and middle-income countries (LMIC). Person-to-person interactions, or 'contacts', facilitate the spread of respiratory and enteric pathogens. The number and nature of contacts likely vary across countries along with social and cultural norms, but few studies have compared behaviors across countries and none have done so with a focus on children. Here we present data from a population-based study conducted from 2021 to 2023 in Guatemala, India, Mozambique, and Pakistan. Across four countries, 5085 participants reported a total of 84,829 contacts across two days. Mean contact rates were highest among 10- to 19-year-olds except in Pakistan, where contacts were highest among 5- to 9-year-olds. Non-home locations which presented high risk for transmission were schools in India, workplaces in Pakistan, and 'other' social / leisure locations in Mozambique and Guatemala. Among children under 5 years of age, the proportion of contacts with non-household members was highest in Mozambique and lowest in India; most of these were reported at home. Contact patterns by age diverge from prior projections that are extrapolated from contact data from high-income countries, underscoring the value of local data collection.


Conflict of interest statement

Competing interests: The authors declare no competing interests.

Figures

Fig. 1
Fig. 1. Daily contact rates by participant age and site, contact age, and location of contact.
Patterns of contact by country and age group. Panel A shows the number of contacts reported on day 1 by age group of participants in rural and urban sites. The center line of the box shows the median, and edges of the box are the 25th percentile (Q1) and 75th percentile (Q3). The minima of the whisker extends to Q1–1.5 *IQR, and the maxima of the whisker extends to Q3 + 1.5*IQR. Dots indicate outliers that exceeded minima or maxima of the whiskers. The number of participants is n = 1143 in Mozambique (Rural: n = 576, Urban: n = 567), n = 1244 in India (Rural: n = 622, Urban: n = 622), n = 1363 in Guatemala (Rural: n = 676, Urban: n = 687), n = 1323 in Pakistan (Rural: n = 650, Urban: n = 673). Panel B shows contact rates by participant age and contact age. Contact rates are made symmetric to adjust for differences in the size of age groups included and lack of reciprocity in contact reporting. Colors in each cell reflect the mean number of contacts reported between age groups, with higher numbers in dark blue and lower numbers in yellow. (The color scale is country-specific to visually demonstrate patterns.) Panel C shows the proportion of contact occurring in each location by age group. Contacts for which the location was not reported are not shown.
Fig. 2
Fig. 2. Mean daily exposure-hours of contact with non-household members by age group and location among children under 5 years of age.
Mean daily exposure-hours were calculated by summing the product of the duration of contact and the number of contacts reported in each location. Contacts for which the location was not reported are not shown. Error bars show 95% confidence intervals of the mean. The number of participants in each age group in each country is as follows; n = 111, 103, 118 in Guatemala, n = 113, 109, 126 in India, n = 128, 146, 135 in Mozambique, n = 133, 130, 128 in Pakistan for <6mo, 6–11mo, and 1–4 y groups, respectively.
Fig. 3
Fig. 3. Comparison of contact rate estimates by age and location of contact with POLYMOD-based projections.
A Mean daily contact rates by age estimated by Prem et al. based on the POLYMOD data and the mean daily contact rates estimated in our study, GlobalMix. 95% confidence intervals are shown with vertical error bars for GlobalMix data. The number of participants is n = 1141 in Guatemala (Rural: n = 575, Urban: n = 566), n = 1244 in India (Rural: n = 622, Urban: n = 622), n = 1352 in Mozambique (Rural: n = 675, Urban: n = 677, n = 1321 in Pakistan (Rural: n = 649, Urban: n = 672). B Proportions of contacts reported in each location, categorized using the POLYMOD scheme. Contacts in GlobalMix for which the location was unreported are shown in brown.
Fig. 4
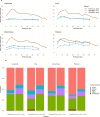
Fig. 4. Effect of contact rate assumptions on epidemic dynamics by country and site.
Brown bars show cumulative incidence of infection estimates under contact patterns based on those reported in Prem et al. which are based on projections using the POLYMOD data. Green and blue bars show cumulative incidence estimates under contact patterns estimates from our study, GlobalMix, in the rural and urban site in each country, respectively.

References

    1. Global health estimates: Leading causes of death. https://www.who.int/data/gho/data/themes/mortality-and-global-health-est... (2000–2021).
    1. Perin, J. et al. Global, regional, and national causes of under-5 mortality in 2000–19: an updated systematic analysis with implications for the Sustainable Development Goals. Lancet Child Adolesc. Health6, 106–115 (2022). - PMC - PubMed
    1. The unfinished agenda of communicable diseases among children and adolescents before the COVID-19 pandemic, 1990–2019: a systematic analysis of the Global Burden of Disease Study 2019. Lancet402, 313–335 (2023). - PMC - PubMed
    1. Read, J. M. et al. Social mixing patterns in rural and urban areas of southern China. Proc. R. Soc. B Biol. Sci.281, 20140268 (2014). - PMC - PubMed
    1. Kiti, M. C., Melegaro, A., Cattuto, C. & Nokes, D. J. Study design and protocol for investigating social network patterns in rural and urban schools and households in a coastal setting in Kenya using wearable proximity sensors. Wellcome Open Res4, 84 (2019). - PMC - PubMed

LinkOut - more resources