. 2025 Oct 30;16(1):9594.
doi: 10.1038/s41467-025-64627-0.

Polygenic viral factors enable efficient mosquito-borne transmission of African Zika virus

Affiliations

Polygenic viral factors enable efficient mosquito-borne transmission of African Zika virus

Shiho Torii et al. Nat Commun. .

Abstract

Zika virus (ZIKV) is a mosquito-borne orthoflavivirus primarily transmitted among humans by Aedes aegypti. Over the past two decades, it has caused significant outbreaks associated with birth defects and neurological disorders. ZIKV consists of two main genotypes: the African and Asian lineages, each exhibiting distinct biological properties. African lineage strains are transmitted more efficiently by mosquitoes, but the genetic basis for this difference has been elusive. Here, we investigate this question by comparing recent African and Asian strains using chimeric viruses with swapped genome segments. Our results show that structural genes from the African strain enhance viral internalization, while non-structural genes improve genome replication and infectious particle production in mosquito cells. In vivo mosquito transmission is most significantly influenced by structural genes, although no single viral gene alone is decisive. We also develop a stochastic model of in vivo viral dynamics that reflects the observed patterns, suggesting the key difference between African and Asian strains lies in their ability to traverse mosquito salivary glands. Our findings imply the polygenic nature of ZIKV transmissibility has hindered Asian strains from achieving the same transmission efficiency as African strains, highlighting the role of lineage-specific adaptive landscapes in ZIKV evolution and emergence.


Conflict of interest statement

Competing interests: The authors declare no competing interests.

Figures
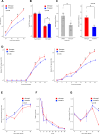
Fig. 1
Fig. 1. Superior growth kinetics of the rSenegal strain are associated with enhanced efficiency of viral internalization and genome replication in mosquito cells.
A Viral growth kinetics of the rSenegal and rThailand strains were assessed by determining infectious virus titers in the supernatant of ZIKV-infected C6/36 cells (MOI of 0.01) by plaque assay. Data are displayed as mean ± SEM of three biological replicates per group. The efficiency of viral attachment (B), internalization (C), and genome replication (D) was measured in C6/36 cells infected at a MOI of 1. B Viral RNA levels bound to the membrane and in the supernatant were quantified one hour post attachment by incubating cells on ice. Data are displayed as mean ± SEM of six biological replicates per group from two separate experiments. C Internalization efficiency was analyzed by quantifying viral RNA relative to Actin mRNA at 3 h post infection (h.p.i.) following protease E treatment. Internalization was normalized to attached viral RNA levels, in cells infected with the rSenegal strain treated with DMSO or Dynasore (left panel) and in cells infected with the rSenegal or the rThailand strains (right panel). The main bar and vertical error bar represent the mean and SEM, respectively. The left panel comprises six biological replicates per treatment from two separate experiments and the right panel comprises four biological replicates per group. D Genome replication was assessed over 24 h by normalizing ZIKV antigenomic RNA levels to those at 12 h.p.i. (left panel) and genomic RNA levels to those at 0 h.p.i. (right panel). E The virus titer-to-viral genome ratio was analyzed over time by infecting C6/36 cells at an MOI of 0.01 and measuring infectious titers by plaque assay and viral genome copy number by RT-qPCR in supernatants. F Viral decay rate was determined by monitoring infectious titer over time at 28 °C, normalized to titer at 0 h. G The cellular ATP levels of ZIKV-infected C6/36 cells was assessed over time using the CellTiter-Glo assay and normalized to the levels at 0 h.p.i. DG Data are displayed as mean ± SEM of three biological replicates per group. AG Statistical significance was determined using two-tailed Student’s t test (*p < 0.05; ns non-significant). Lines and bars are color-coded according to the virus strain. Source data with the exact p values are provided in the Source Data file for Fig. 1.
Fig. 2
Fig. 2. Structural genes enhance viral internalization, and non-structural genes improve genome replication of rSenegal strain relative to rThailand strain in mosquito cells.
A Schematic representation of the first set of chimeric viruses. B Plaque morphologies of chimeric viruses on Vero E6 cell monolayers. Plaque diameters were measured using ImageJ software for quantification. Data are displayed as mean ± SEM of six or seven biological replicates per group. C Viral growth kinetics of chimeric viruses with rSenegal (left panel) or rThailand (right panel) backbones were determined by measuring infectious titers from supernatants of ZIKV-infected C6/36 cells (MOI = 0.01) by plaque assay. The efficiency of viral internalization (D) and genome replication (E) was analyzed in C6/36 cells infected with ZIKV at an MOI of 1. Viral RNA levels were assessed by calculating the ratio of viral RNA to Actin expression at 3 h.p.i. for internalization (D) and over 24 h for genome replication (E) following protease E treatment. Internalization efficiency (D) was determined by normalizing viral RNA at 3 h.p.i. to levels of initially attached viruses. Genome replication (E) was evaluated by normalizing ZIKV antigenomic RNA levels at each time point to 12 h.p.i. (left panel) and genomic RNA levels to baseline levels at 0 h.p.i. (right panel). F The cellular ATP levels following ZIKV infection was assessed over time using the CellTiter-Glo assay and normalized to the levels at 0 h.p.i. CF Data are presented as mean ± SEM of three biological replicates per group. BF Statistical analysis was performed using one-way ANOVA with Dunnett’s test (*p < 0.05; **p < 0.001; ns non-significant). Lines and bars are color-coded to represent the different chimeric viruses, and the parental strains are depicted with thicker lines. Source data with the exact p values are provided in the Source Data file for Fig. 2.
Fig. 3
Fig. 3. Structural and non-structural genes collectively drive differences in mosquito transmission between rSenegal and rThailand strains.
Aedes aegypti mosquitoes from Colombia were orally exposed to the first set (AC), second set (DF), or third set (GI) of chimeric viruses via an infectious blood meal. Mosquitoes were collected on days 7, 10, and 14 post infectious blood meal to assess the prevalence of midgut infection (A, D, G), systemic viral dissemination (B, E, H), and transmission potential (C, F, I) for each ZIKV strain. Infection prevalence is the proportion of blood-fed mosquitoes with a virus-positive body (measured by RT-PCR). Dissemination prevalence is the proportion of infected mosquitoes with a virus-positive head (measured by RT-PCR). Transmission prevalence is the proportion of mosquitoes with a disseminated infection and infectious saliva (measured by focus-forming assay). AI Data points show the empirically measured proportions, with point size proportional to sample size (number of mosquitoes). To achieve a sufficiently large sample size,the experiments of the first and second sets were repeated twice and any variation between experiments was incorporated into the statistical analysis. Logistic regression results are represented by fitted lines, with error bars indicating 95% confidence intervals for the logistic fits. Lines and points are color-coded to represent the different chimeric viruses, and the parental strains are depicted with thicker lines. Raw data and logistic regression results are provided in Supplementary Tables S4 and S5, respectively. Source data with the exact proportions and their 95% confidence intervals are provided in the Source Data file for Fig. 3.
Fig. 4
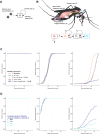
Fig. 4. Modeling ZIKV infection dynamics identifies salivary gland traversal as the primary driver of differences in transmissibility.
A Conceptual model for in vitro viral dynamics. The dynamics are described using a logistic growth curve as per Eq. (1) (see Methods). B Conceptual model for in vivo viral dynamics. The mosquito image was created using BioRender: TORII, S. (2025) https://biorender.com/dbcfk4s. After ingestion of a blood meal containing infectious virus (Gv), the virions are degraded in the blood meal according to a clearance rate (μ). The probability that at least one virion infects the midgut epithelium (β) determines whether infection is established. If infection occurs in the midgut (Mv), the virus replicates at a growth rate (r) constrained by the carrying capacity (k). The virus may then disseminate to the hemocoel according to an ‘escape’ rate (λ). Virus in the hemocoel (Hv) undergoes similar replication dynamics as in the midgut and can ‘escape’ to infect the salivary glands (Sv), which eventually enables virus release into saliva. The simplest model assumes fixed parameter values (r, k, λ) across tissues and no between-mosquito variation in probabilities or rates. These assumptions are relaxed stepwise to evaluate processes underlying experimental observations. C Model outputs for viral dissemination. The proportion of simulations reaching the hemocoel is shown for five model scenarios (Table 1). Across all scenarios, except scenario five, transmission occurs in 100% of simulations. Scenario five introduces random variation in the transfer of virions between the hemocoel and salivary glands, enabling a reduced proportion of simulations with transmission, consistent with experimental findings. D Proposed hypothesis for difference between chimeric viruses of the first set. Results from scenario five suggest that differences in chimeric viruses may arise from variability in the rate at which virions infect the salivary glands and/or are released into saliva. This variability can be represented by a Gamma distribution, with variance adjusted between simulations to reflect distinct virus-mosquito interactions. Example Gamma distributions were modeled with variances of 10⁻⁷.⁵, 10⁻⁷.³, 10⁻⁷, and 0⁻⁶.⁵ to show the effects of this variation.

Update of

References

    1. Boyer, S., Calvez, E., Chouin-Carneiro, T., Diallo, D. & Failloux, A. B. An overview of mosquito vectors of Zika virus. Microbes Infect.20, 646–660 (2018). - PubMed
    1. Gutierrez-Bugallo, G. et al. Vector-borne transmission and evolution of Zika virus. Nat. Ecol. Evol.3, 561–569 (2019). - PMC - PubMed
    1. Musso, D. & Gubler, D. J. Zika virus. Clin. Microbiol. Rev.29, 487–524 (2016). - PMC - PubMed
    1. Petersen, L. R., Jamieson, D. J., Powers, A. M. & Honein, M. A. Zika virus. N. Engl. J. Med.374, 1552–1563 (2016). - PubMed
    1. Baud, D., Gubler, D. J., Schaub, B., Lanteri, M. C. & Musso, D. An update on Zika virus infection. Lancet390, 2099–2109 (2017). - PubMed