. 2025 Oct 31;21(10):e1012829.
doi: 10.1371/journal.ppat.1012829. eCollection 2025 Oct.

Mycobacterium tuberculosis triggers reduced inflammatory cytokine responses and virulence in mice lacking Tax1bp1

Affiliations

Mycobacterium tuberculosis triggers reduced inflammatory cytokine responses and virulence in mice lacking Tax1bp1

Jeffrey Chin et al. PLoS Pathog. .

Abstract

Host responses - autophagy, cell death, and inflammation - limit the growth of bacterial pathogens while minimizing tissue damage. During the early stages of infection, Mycobacterium tuberculosis (Mtb) thwarts these and other innate immune defense mechanisms in alveolar macrophages (AMs) derived from the yolk sac; in later stages, it circumvents defenses in recruited mononuclear cells (MNCs) and survives within them despite additional cytokine stimulation from recruited T cells. The mechanisms that drive variable rates of Mtb growth in different macrophage subtypes and how Mtb manipulates inflammatory responses to grow within innate immune cells remain obscure. Here we explored the role of the host factor, Tax-1 binding protein 1 (Tax1bp1), an autophagy receptor that targets pathogens for degradation through selective autophagy and terminates pro-inflammatory cytokine responses. Unexpectedly, we found that Tax1bp1-deficient mice were less susceptible to Mtb infection, and generated reduced inflammatory cytokine responses, compared to wild-type mice; the same mutant mice exhibited decreased growth of, and inflammatory cytokine responses to, Listeria monocytogenes, suggesting that Tax1bp1 plays a role in host responses to multiple intracellular pathogens. Contrary to our previous ex vivo findings in bone marrow-derived macrophages (BMDMs), in vivo growth of Mtb in AMs and a subset of recruited MNCs was more limited in mice lacking Tax1bp1 relative to wild-type mice. To better understand these differences, we performed global protein abundance measurements in mock- and Mtb-infected AM samples ex vivo from wild-type mice. These experiments revealed that Tax1bp1 protein abundance does not significantly change early after infection in AMs but does in BMDMs; moreover, early after infection, Tax1bp1-deficiency reduced necrotic-like cell death -- an outcome that favors Mtb replication -- in AMs but not BMDMs. Together, these results show that deficiency of Tax1bp1 plays a crucial, cell type-specific role in linking the regulation of autophagy, cell death, and anti-inflammatory host responses and overall reducing bacterial growth.


Conflict of interest statement

The authors have declared that no competing interests exist.

Figures

Fig 1
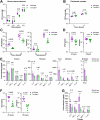
Fig 1. Tax1bp1-deficiency abrogates M. tuberculosis virulence and inflammatory cytokine responses during mouse aerosol infection.
(A) Age and sex-matched male and female mice were infected by the aerosol route with a mean Mtb CFU of 240 as determined by CFU enumeration from lung homogenates at 1-day post-infection. (B) Male mice were euthanized at 11 and 21-days post-infection for CFU enumeration. Female mice were euthanized at 50-days post-infection. Results are the mean ± SEM from lung homogenates of 4-5 infected mice per genotype. (C) Cytokine levels from infected lung homogenates at 11-, 21-, and 50-days post-infection were measured by ELISA. Results are the mean ± SEM from five samples. (D) Levels of type I and II interferon-induced JAK/STAT signaling were measured by luminescence in relative light units (RLUs) from infected lung homogenates by the ISRE assay. Results are the mean ± SEM from five samples. Brackets indicate p values from t-test comparisons. (E) Infected mice were monitored for death or 15% loss of maximum body weight, at which point they were euthanized. Log-rank (Mantel-Cox) test and Gehan-Breslow-Wilcoxon comparison test p values for survival were 0.0008 and 0.0047, respectively. (F) The weight of the infected mice is displayed. The connecting line denotes the mean weight of the mice alive at each time point.
Fig 2
Fig 2. Tax1bp1-deficiency impaired Listeria monocytogenes virulence and growth during murine but not ex vivo cellular infections.
(A and B) BMDMs or peritoneal exudate cells were infected with L. monocytogenes, and CFU were counted at 30 minutes, 2-, 5-, or 8 hours post-infection. Results are the mean ± SEM from three technical replicate samples. The p values from t-test comparisons are shown. (C and D) CFU from spleen and liver homogenates from mice intravenously infected with L. monocytogenes were enumerated at 4-, 10-, or 48-hours post-infection. Results are the mean ± SEM from five mice. Brackets indicate p values from t-test comparisons. (E & G) Cytokine levels were measured from the serum of mice infected with L. monocytogenes at 4-, 10-, and 48-hours post-infection by cytometric bead array (IL-6, TNF-α, IFN-γ, MCP-1, IL-10) or ELISA (IFN-β). Results are mean ± SEM from five samples. Brackets indicate p values from t-test comparisons. (F) Spleen and liver homogenates from mice intraperitoneally infected with L. monocytogenes were enumerated for CFU 72 hours post-infection. Results are the mean ± SEM from five mice. Brackets indicate p values from t-test comparisons. CFU data were logarithmically transformed prior to statistical analysis.
Fig 3
Fig 3. Tax1bp1-deficiency impairs neutrophil and CD8+-T cell recruitment to the lungs during Mtb infection.
Lung homogenates from female mice (day 14, 21 post-infection) and male mice (day 28 post-infection) infected with ZsGreen-expressing Mtb were stained for antibodies to detect immune cells and analyzed by flow cytometry. (A and C) Displayed are the immune cell subtype proportions of the single cell population from individual mouse lung samples. To account for differences in the number of cells analyzed between genotypes, data were normalized by dividing the proportion of each single cell population by the total number of each live cell type analyzed. (B and D) Displayed are the ZsGreen+ counts quantified in each immune cell subtype from individual mouse lung samples. Data were normalized to the number of cells sorted. Mean and SEM are displayed. The p-values from t-test comparisons are shown.
Fig 4
Fig 4. Mtb growth was restricted in Tax1bp1-/- AMs infected ex vivo.
AMs were infected ex vivo with luciferase-expressing Mtb H37Rv (A, B) or wild-type Mtb Erdman (C) at a M.O.I. of 1 in the presence or absence of IFN-γ added at the time of infection. (A) The media was replaced with fresh media daily. Monolayer luminescence was measured daily. (B, C) CFU were measured immediately after infection (day 0) or 4 days post-infection. Displayed are the mean, SEM, and FDR-adjusted p values from the t-test.
Fig 5
Fig 5. Global protein abundance changes during Mtb infection of AMs.
In five independent biological replicate experiments, wild-type AMs were mock- or Mtb-infected at a M.O.I. of 10. At 24-hours post-infection, AM lysates were harvested, and the samples were digested with trypsin for LC-MS/MS analysis. The amino acid sequence, the relative levels of peptides, and the protein ID for the peptides were determined by a database search and statistical analysis in the infected vs. mock-infected samples. (A) Volcano plot displaying the proteins that significantly changed in abundance. The grey line denotes an adjusted p value of 0.05. Statistically significant hits with a log2fold change > 1 (yellow) or <-1 (blue) and an adjusted p value < 0.05 are highlighted. (B) Area-proportional Venn diagram displaying the number of statistically significant proteins that changed in abundance during Mtb infection of AMs and BMDMs. (C) Gene ontology enrichment analysis of statistically significant hits from global protein abundance analysis of the changes during Mtb infection of AMs, BMDMs, or both cell types. The enrichment analysis was performed with Metascape [59].
Fig 6
Fig 6. Tax1bp1-deficiency results in differential expression of inflammatory response and apoptotic signaling pathway genes during Mtb infection of AMs.
Wild-type and Tax1bp1-/- AMs were infected in biological triplicate with Mtb at a M.O.I. of 2. The RNA was harvested at 36-hours post-infection for differential pathogen and host gene expression analysis by RNAseq. Gene ontogeny enrichment analysis of statistically significant differentially expressed host genes (log2(fold change) >1 or <-1, adj. p values <0.05) during Mtb infection of wild-type and Tax1bp1-/- AMs was performed with Metascape [59]. Among this analysis of the up- and down-regulated genes triggered by Tax1bp1-deficiency, the top ten enriched pathways and the number of genes in each functional pathway are displayed.
Fig 7
Fig 7. IL-6, IL-1β, and PGE2 production was abrogated during AM infection of Tax1bp1-/- AMs.
AMs were seeded at 100,000 cells/well and infected in triplicate wells with Mtb at a M.O.I. of 5. At 24 hours post-infection, (A) the supernatants were collected for cytokine measurement by ELISA, and (B) AM monolayers were lysed and plated for Mtb CFU. Mean, SEM, and p values from the t-test are displayed.
Fig 8
Fig 8. Necrotic-like cell death was inhibited and apoptosis accelerated in Mtb-infected Tax1bp1-/- AMs.
AMs were infected with Mtb at a M.O.I. of 1 in the presence of CellEvent caspase 3/7 to detect apoptotic cells and propidium iodide (PI) for necrotic/late apoptotic cells without (A, B) or with (C, D) IFN-γ added to the media. Fluorescence images were obtained at 20X magnification in two positions per well in three replicate wells. (A, C) Representative fluorescence and brightfield microscopy images were merged, cropped, and scaled. (B, D) The number of fluorescent cells in each field was quantified in the green (CellEvent) and red fluorescence (PI) channels. Fluorescent cell numbers were normalized by the total number of cells in the phase contrast image for each field. Mean, SEM, and statistically significant FDR-adjusted p values from t-test comparisons are displayed. For clarity, only statistically significant p values (p< 0.05) are shown. The white bar depicts 100 μm. Data are representative of three independent experiments. (E) Tax1bp1-deficiency restricts Mtb growth, inflammatory cytokine synthesis, PGE2 production, and necrotic-like host cell death in AMs.

References

    1. Stutz MD, Clark MP, Doerflinger M, Pellegrini M. Mycobacterium tuberculosis: Rewiring host cell signaling to promote infection. J Leukoc Biol. 2018;103(2):259–68. doi: 10.1002/JLB.4MR0717-277R - DOI - PMC - PubMed
    1. Goren MB, D’Arcy Hart P, Young MR, Armstrong JA. Prevention of phagosome-lysosome fusion in cultured macrophages by sulfatides of Mycobacterium tuberculosis. Proc Natl Acad Sci U S A. 1976;73(7):2510–4. doi: 10.1073/pnas.73.7.2510 - DOI - PMC - PubMed
    1. Gideon HP, Hughes TK, Tzouanas CN, Wadsworth MH, Tu AA, Gierahn TM. Multimodal profiling of lung granulomas in macaques reveals cellular correlates of tuberculosis control. Immunity. 2022;55(5):827-846.e10. doi: 10.1016/j.immuni.2022.04.008 - DOI - PMC - PubMed
    1. Cohen SB, Gern BH, Delahaye JL, Adams KN, Plumlee CR, Winkler JK. Alveolar Macrophages Provide an Early Mycobacterium tuberculosis Niche and Initiate Dissemination. Cell Host Microbe. 2018;24(3):439-446.e4. - PMC - PubMed
    1. Huang L, Nazarova EV, Tan S, Liu Y, Russell DG. Growth of Mycobacterium tuberculosis in vivo segregates with host macrophage metabolism and ontogeny. J Exp Med. 2018;215(4):1135–52. doi: 10.1084/jem.20172020 - DOI - PMC - PubMed

MeSH terms

Substances