. 2025 Oct 31;16(1):9587.
doi: 10.1038/s41467-025-65167-3.

CRISPR targeting of H3K4me3 activates gene expression and unlocks centromere-proximal crossover recombination in Arabidopsis

Affiliations

CRISPR targeting of H3K4me3 activates gene expression and unlocks centromere-proximal crossover recombination in Arabidopsis

Jenia Binenbaum et al. Nat Commun. .

Abstract

H3K4me3 is a fundamental and highly conserved chromatin mark across eukaryotes, playing a central role in many genome-related processes, including transcription, maintenance of cell identity, DNA damage repair, and meiotic recombination. However, identifying the causal function of H3K4me3 in these diverse pathways remains a challenge, and we lack the tools to manipulate it for agricultural benefit. Here we use the CRISPR-based SunTag system to direct H3K4me3 methyltransferases in the model plant, Arabidopsis thaliana. Targeting of SunTag-SDG2 activates the expression of the endogenous reporter gene, FWA. We show that SunTag-SDG2 can be employed to increase pathogen resistance by targeting the H3K4me3-dependent disease resistance gene, SNC1. Meiotic crossover recombination rates impose a limit on the speed with which new traits can be transferred to elite crop varieties. We demonstrate that targeting of SunTag-SDG2 to low recombining centromeric regions can significantly stimulate proximal crossover formation. Finally, we reveal that the effect is not specific to SDG2 and is likely dependent on the H3K4me3 mark itself, as the orthogonal mammalian-derived H3K4me3 methyltransferase, PRDM9, produces a similar effect on gene expression with reduced off-target potential. Overall, our study supports an instructive role for H3K4me3 in transcription and meiotic recombination and opens the door to precise modulation of important agricultural traits.


Conflict of interest statement

Competing interests: The authors declare no competing interests.

Figures

Fig. 1
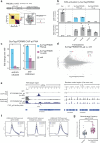
Fig. 1. SunTag-SDG2 activates FWA mRNA expression.
a Schematic showing the SunTag system for modulation of chromatin,. Created in BioRender. b The upper panel shows SDG2 with the catalytic SET domain (drawn approximately to scale). Lower left depicts predicted alignment error (PAE) plot from AlphaFold3 prediction of the SDG2 coding sequence with a box drawn around the region cloned into SunTag (amino acids 1571–2335). Lower right depicts the AlphaFold3 model for SDG21571-2335, with the position of the amino acid change (Y1903F) for dSDG2 indicated (shown in red). c RT-qPCR for FWA expression from the genotypes indicated. Error bars represent SEM from three biological replicates (a pool of 10 seedlings) from the lines (#) and genotypes indicated. *** indicates p < 0.005 (ANOVA with post-hoc Tukey HSD. d ChIP qPCR for the presence of SunTag (left panel) and H3K4me3 enrichment (right panel) over the TSS of FWA. The control region (AT5G65130) used for normalisation has high H3K4me3. e Genome browser images showing ChIP-seq enrichment of SunTag (anti-HA) and H3K4me3 levels of two independent SunTag:SDG2:FWA_g4 lines (2 biological replicates each, bio replicate tracks are overlaid) at the FWA TSS (left panel) and at a random genic control region. f MA plot comparing the transcriptome of SunTag:SDG2:FWA_g4 as compared to the non-transformed control (rdr6). Differentially expressed genes were defined using an adjusted p-value (Bonferroni method), shown in red (FDR < 0.01), with FWA labelled and enlarged for visibility. g H3K4me3 ChIP-seq metaplots over all genes, H3K4me3 endogenous peaks, and TSS regions.
Fig. 2
Fig. 2. SunTag-SDG2 targeting to SNC1 enhances resistance to P. syringae.
a Upper, schematic of the SNC1 gene, with the red line indicating the SNC1 gRNA target site, drawn to scale. Lower, representative images of 3-week-old plants from the genotypes indicated. Scale bar = 1 cm. b Rosette size quantification. Each dot represents an individual plant. Error bars represent SEM. Different letters indicate significant difference by ANOVA with post-hoc Tukey HSD, p < 0.05. n = 14 for SunTag:dSDG2:SNC1_g4 #1, n = 15 for the rest. c ChIP qPCR for the presence of SunTag at SNC1. d RT-qPCR for SNC1 expression. Error bars represent SEM. * indicates p-value = 0.045 by Student’s t-test. n = 4 biological replicates (each a pool of 10 seedlings). e Pst::LUX assay for colonisation quantification at 3 days post-inoculation. Different letters indicate significant difference by ANOVA with post-hoc Tukey HSD, p < 0.05. Boxplots show the median, the interquartile range, whiskers extending to 1.5× the interquartile range, and individual data points plotted as dots. n = 96 wells, containing 3 seedlings each.
Fig. 3
Fig. 3. Centromeric targeting of SunTag-SDG2 elevates meiotic crossover recombination rate.
a Region of chromosome 3, showing CENH3 ChIP-seq enrichment with CTL3.9 red/green T-DNA marker positions and LRCen3 guide RNA binding sites indicated. b Left panel, representative image of red and green fluorescing seeds from a CTL3.9 double homozygous line. Right panel, schematic showing how crossovers are identified within CTL3.9. c Boxplot showing crossover recombination frequency over CTL3.9 in centiMorgans. Control data is from Col-0 (non-transgenic) crossed to CTL3.9. Different letters indicate significant difference by ANOVA with post-hoc Tukey HSD (p < 0.05). Control: n = 12, LRCen3 F3: n = 19, No guide: n = 6, LRCen3 F4: n = 14. Boxplots show the median, the interquartile range, whiskers extending to 1.5× the interquartile range, and individual data points plotted as dots. The red dot indicates the seed set line taken to the next generation (F4). d Chromosome-wide plots of chromosome 3. Upper panels show enrichment of SunTag (anti-HA) by ChIP-seq in sibling lines with/without SunTag (±). Enrichment is calculated as log2 fold change over non-transgenic (Col-0) controls in 100 kb windows. The middle panel shows H3K4me3 enrichment over H3K4me3 peaks (log2 fold change over non-transgenic (Col-0) controls). The lower panel depicts an LRCen3 guide RNA binding site density over chromosome 3. CTL3.9 marker positions are indicated, and centromeric regions are shown in grey. All data are mapped to the Col-CEN genome assembly.
Fig. 4
Fig. 4. SunTag-PRDM9 is sufficient for activation of FWA.
a Upper panel shows PRDM9 with catalytic SET domain (drawn approximately to scale). The lower left depicts a predicted alignment error (PAE) plot from AlphaFold3 prediction of the PRDM9 coding sequence with a box drawn around the region cloned into SunTag (amino acids 110–417). The lower right depicts the AlphaFold3 model for PRDM9110-417, with the amino acid change for dPRDM9 indicated (position shown in red). b RT-qPCR for FWA (upper panel) and the effector module (sfGFP, lower panel) for the genotypes indicated. Dots represent individual plants, with two independent T3 lines used per construct, 3 biological replicates per construct. Error bars represent SEM. c ChIP qPCR for the presence of SunTag (left panel) and H3K4me3 enrichment (right panel) over the TSS of FWA. d MA plot comparing the transcriptome of SunTag:PRDM9:FWA_g4 as compared to the non-transformed control (rdr6). Differentially expressed genes were defined using an adjusted p-value (Bonferroni method), shown in red (FDR < 0.01), with FWA labelled and enlarged for visibility. e Genome browser image showing efficient SunTag targeting and H3K4me3 enrichment at FWA and at a random genic control region. Biological replicate tracks from independent lines are overlaid. f H3K4me3 ChIP-seq metaplots over all genes, H3K4me3 endogenous peaks, and TSS regions. g Boxplot showing crossover recombination frequency over CTL3.9 in centiMorgans (p < 0.001, two-sample, two-sided t-test). Boxplots show the median, the interquartile range, whiskers extending to 1.5× the interquartile range, and individual data points plotted as dots. n = 24 for control, n = 17 for Suntag:PRDM9:LRCen3_g.

References

    1. Lloyd, J. P. B. & Lister, R. Epigenome plasticity in plants. Nat. Rev. Genet.23, 55–68 (2022). - PubMed
    1. Schwaiger, M. et al. Evolutionary conservation of the eumetazoan gene regulatory landscape. Genome Res24, 639–650 (2014). - PMC - PubMed
    1. Wang, H. & Helin, K. Roles of H3K4 methylation in biology and disease. Trends Cell Biol.xx, 1–14 (2024). - PubMed
    1. Howe, F. S., Fischl, H., Murray, S. C. & Mellor, J. Is H3K4me3 instructive for transcription activation?. BioEssays39, 1–12 (2017). - PubMed
    1. Perez, M. F. & Sarkies, P. Histone methyltransferase activity affects metabolism in human cells independently of transcriptional regulation. PLoS Biol.21, 1–31 (2023). - PMC - PubMed

MeSH terms

LinkOut - more resources