. 2025 Oct 31;23(1):470.
doi: 10.1186/s12964-025-02472-w.

The intracellular domains of the DSL ligands Serrate and Delta provide different activities

Affiliations

The intracellular domains of the DSL ligands Serrate and Delta provide different activities

Ekaterina Seib et al. Cell Commun Signal. .

Abstract

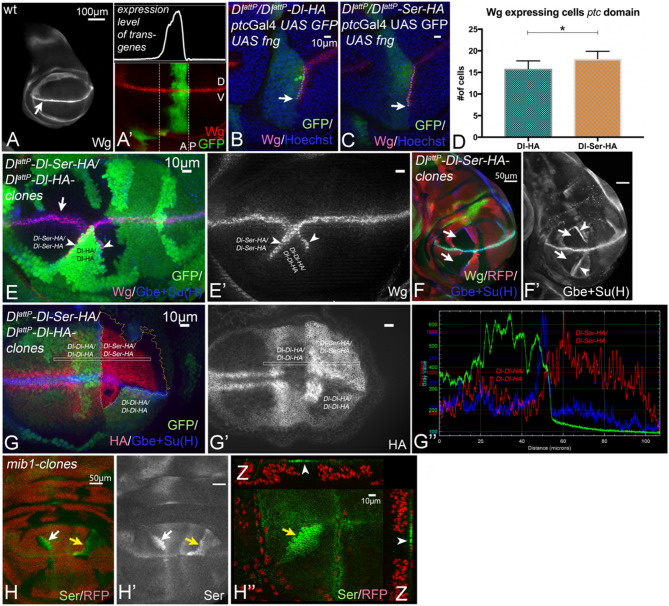
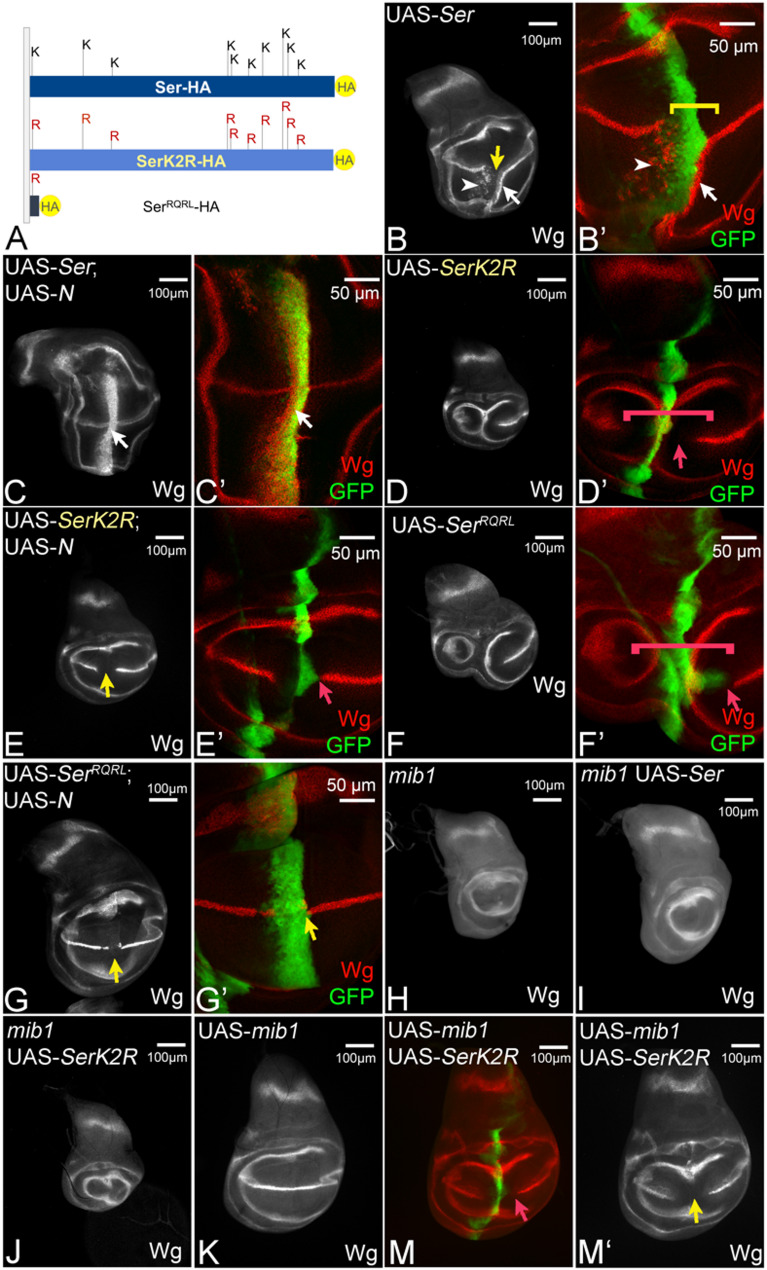
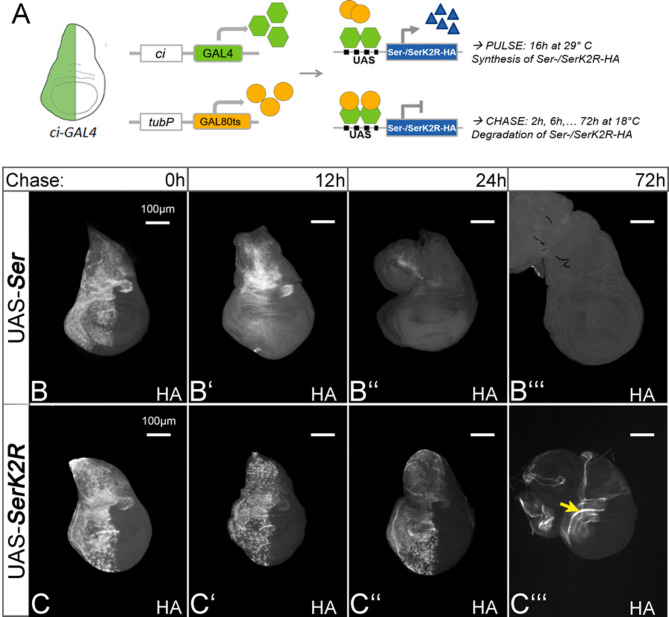
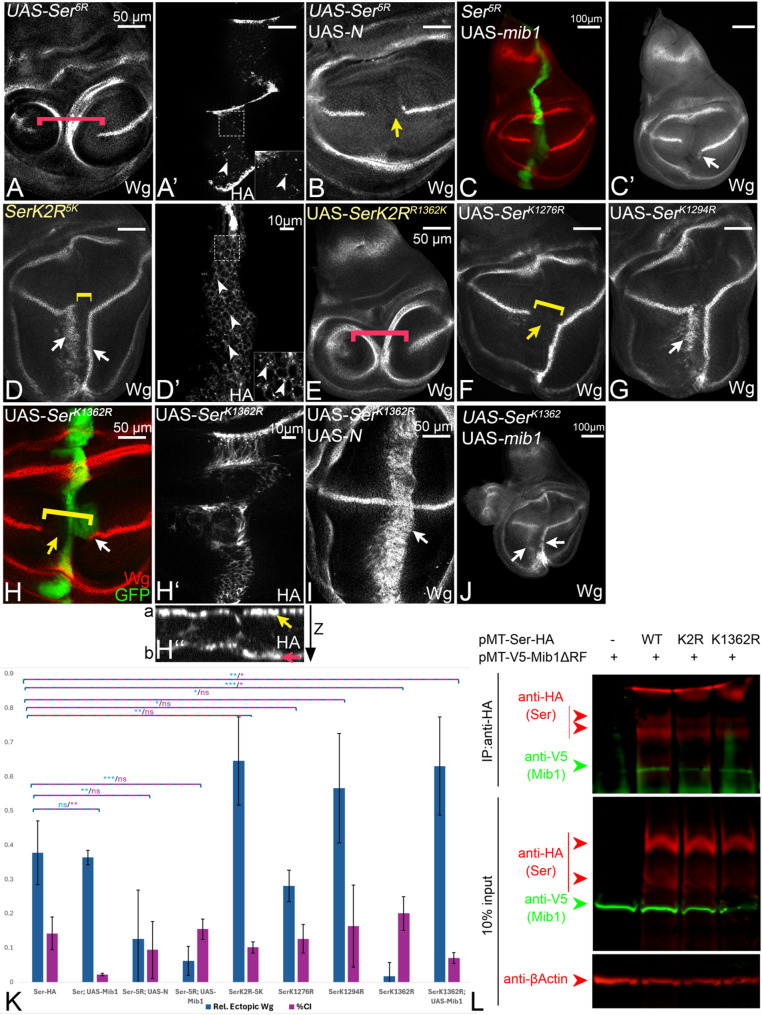
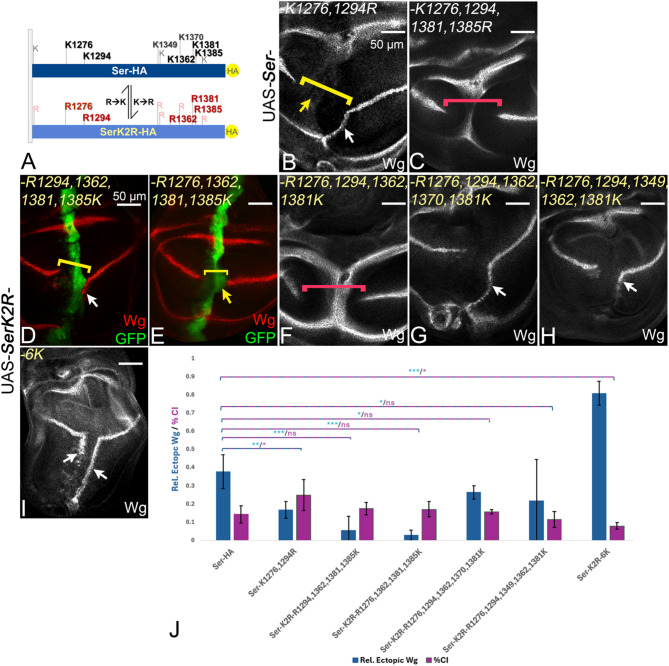
Endocytosis of the ligands is a central requirement for the correct activation of the Notch-signalling pathway. It is initiated by E3-ligase mediated ubiquitylation (ubi) of the intracellular domain (ICD) of the ligands on lysine (K). In Drosophila, two ligands are present, termed Serrate (Ser) and Delta (Dl). They are ubiquitylated by the E3-ligases Mindbomb1 (Mib1) and Neuralized (Neur). Here, we show that the ICDs of Dl and Ser have different activities. We characterised the properties of the Ser-ICD and focused on the meaning of its Ks for ubi and signalling activity. For this purpose, we generated a variant in which all Ks of its ICD are replaced by the structurally similar arginine (R), termed SerK2R. Its analysis revealed that, in contrast to Dl, the Ks are essential for the endocytosis and degradation of Ser by Mib1. Moreover, whereas Dl possesses an ubi- and Mib1-independent signalling activity, Ser-signalling completely depends on Mib1-dependent ubi. We found that a minimum of five conserved Ks in the ICD are required for the Mib1-mediated activation of Ser and that the importance of the individual Ks differs. These core Ks appear to preferentially channel Ser into a rare signalling-relevant endocytosis pathway. Remarkably, the addition of a sixth K largely restores also bulk endocytosis, which is irrelevant for signalling. Thus, at least 6 of the 10 Ks of the ICD are required for the complete activity/behaviour of Ser.

Supplementary Information: The online version contains supplementary material available at 10.1186/s12964-025-02472-w.

Keywords: Cis-inhibition; DSL-ligands; Delta; Dl; E3-ligases; Endocytosis; Mib1; Mindbomb1; Notch-pathway; Ser; Serrate; Ubiquitylation.


Conflict of interest statement

Declarations. Ethics approval and consent to participate: Not applicable. Consent for publication: All the authors of this manuscript consent to its publication as a research article in BMC Biology. Competing interests: The authors declare no competing interests.

Figures

Fig. 1
Fig. 1
The activity of the ICD of Ser. A, A’ Expression patterns of Wg (A) and ptcGal4 (A’) in a wildtype wing imaginal disc at the late third instar stage. Wg is expressed in a narrow stripe along the D/V-boundary (A, arrow). ptcGal4 is expressed in a band at the anterior side of the A/P boundary. In the domain, expression occurs in a gradient that increases to the A/P-boundary. Note, that the band of ptcGal4 expression runs perpendicular to that of Wg. D: dorsal; V: ventral. B-D Ectopic expression of Fng with ptcGal4 in DlattP/DlattP-Dl (B) and DlattP/DlattP-Dl-Ser (C) flies. It induces the ectopic expression of Wg in a stripe that straddles the A/P compartment boundary (B, C, arrow). The quantification of the length of the ectopic stripe shown in (D) reveals that the ectopic stripe is significantly longer in DlattP/DlattP-Dl-Ser discs (n=5). E-G’’ Clonal analysis of DlattP-Dl-Ser. E, E’ Induction of adjacent homozygous DlattP-Dl-Ser (black) and DlattP-Dl (dark green) twin clones. Ectopic expression of Wg is induced in the boundary cells of DlattP-Dl clones, which are located adjacent to clones homozygous for DlattP-Dl-Ser (arrowheads). F, F’ A wing disc bearing DlattP-Dl-Ser homozygous clones, labelled by the absence of RFP (arrows). (F’) Expression of the Notch reporter Gbe+Su(H) is strongly suppressed in the DlattP-Dl-Ser homozygous clones (arrows). The arrowheads point to the elevated expression of the Notch activity reporter in boundary cells of homozygous DlattP-Dl clones. G, G’ Comparison of membrane levels of the Dl-variants in adjacent homozygous DlattP-Dl-Ser (black area) and DlattP-Dl clones by anti-HA stainings. It reveals that the levels of Dl-Ser in the plasma membrane are higher than that of Dl. (G’’) Pixel density measurement in the region highlighted in (G’) with the rectangle. H, H’’ A disc bearing mib1 mutant cells clones, highlighted by the arrows and labelled by the absence of RFP. Ser accumulates in the plasma membrane of the mib1 mutant cells (arrows)
Fig. 2
Fig. 2
Ser requires the Ks of its ICD for Mib1-dependent signalling. A Cartoon of the ICDs of the Ser-variants. B, Expression of Ser by ptcGal4 induces ectopic expression of Wg in two stripes in the ventral compartment, (arrow and arrowhead). At high level of Ser expression, close to the A/P compartment boundary, the endogenous expression of Wg is interrupted due to CI (yellow arrow in B and bracket in B’). C, C’ Co-expression of Ser with Notch results in suppression of CI, revealed by the ectopic Wg expression in the whole ptc domain (white arrow, compare with Fig. S2C). D, D’, F, F’ Expression of UAS-SerK2R, or UAS-SerRQRL, fails to ectopically induce the expression of Wg and interrupts its endogenous expression along the D/V-boundary at the intersection point (bracket and arrow in D’ and F’). Note, that the inhibitory effect on Wg expression occurs several cell diameters aways from the ptc expression domain (highlighted by the red arrow). This non-cell-autonomous effect indicates that SerK2R and SerRQRL act in a dominant-negative manner. E, E’, G, G’ Co-expression of SerK2R or SerRQRL with Notch results only in the mutual suppression of the effects caused by each construct alone, but not to ectopic expression (yellow arrow, compare with Fig. 2S1C). H A mib1 mutant wing imaginal disc. The expression of Notch along the D/V-boundary is lost due to the loss of Notch-signalling (compare with Fig. 1A, arrow). I, J Expression of Ser (I) and SerK2R (J) in a mib1 mutant discs fails to initiate ectopic Notch-signalling. K Over-expression of Mib1 has no effect on the expression of Wg along the D/V-boundary. M, M’ Co-expression of Mib1 with SerK2R results in a phenotype that resembles that of expression of SerK2R alone. The red arrow in (M) points to the non-cell-autonomous interruption of the expression of Wg. It indicates that the additional over-expression of Mib1 has no effect of the activity of SerK2R. The yellow arrow in (M’) highlights the gap in the expression of Wg
Fig. 3
Fig. 3
The intracellular Ks are essential for the Mib1-mediated endocytosis of Ser. A-F’ Subcellular localisation of the Ser-variants revealed by anti-HA antibody staining. a: apical; b: basal. Rab7 staining was used to mark endosomes. Nrx staining in (E-F’) labels the apical side of the epithelium. A-A’’, E,E’ Subcellular localisation of Ser in wildtype wing imaginal discs. Ser localises at the apical membrane and Rab7-positive endosomes (red arrow and arrowheads, respectively). The frame in A shows an enlarged view of the area marked with the rectangle. The arrowheads point to some of the Ser-HA- and Rab7-positive vesicles. B-B'' In mib1 mutant cells, endocytosis of Ser is strongly reduced (see also Fig. 1H-H’’). Most of the HA signal can be observed at the apical and the basal membrane (red and yellow arrow in B', respectively). Moreover, Ser is virtually absent from endosomes. Note the accumulation of Ser also in the basal membrane (yellow arrow). C-C'', F,F’ SerK2R localisation in wild-type cells. Ser localises to the apical and to the basal membrane, but is hardly seen in endosomes (red and yellow arrow, respectively). D Expression of SerRQRL in wildtype cells results in its accumulation in the apical membrane (red arrow). This indicates that the ICD of Ser is not required for the transport of Ser to the apical membrane. G-N Antibody uptake assay to analyse the endocytosis of Ser, SerK2R and SerK1362R in S2R+ cells. G Design of the assay. The antibody is raised against the ECD of Ser. H, I, J, K, L At time point 0, all antibody labelled Ser-variants were located in the plasma membrane. (H1-H2, J1-J2, L1-L2). In absence of Mib1, Ser, SerK2R, SerK1362R were present in plasma membrane after 30 and even 60 min., indicating that they are not efficiently endocytosed in the absence of Mib1. (I-I2’) Co-expression of Ser with Mib1. The presence of Mib1 results in the efficient internalisation of Ser, which localises to Rab7-positive endosomes after 30 and 60 min. No Ser was observed in the plasma membrane already after 30 min. (K-K2’) In contrast to Ser, the presence of Mib1 does not induce the internalisation of SerK2R, indicated by the presence of SerK2R in the plasma membrane, even after a chase of 60 min. (L-M2’) SerK1362R can be endocytosed in the presence of Mib1. However, in contrast to Ser, a fraction is still present at the plasma after a chase of 30’, suggesting that it is less efficiently endocytosed than Ser. N Quantification of the endocytosis of the Ser-variants. For the quantification, the cells were counted in which anti Ser-ECD was detected either at the plasma membrane (PM), at the plasma membrane and in vesicles (PM/V) or in vesicles only (V). The corresponding cell number was calculated in relation to the total cell number. The analysis reveals that SerK1362R is less efficiently endocytosed than Ser, but more efficiently than SerK2R
Fig. 4
Fig. 4
Degradation of Ser and SerK2R. A Design of the pulse-chase experiment. Ser-HA and SerK2R-HA were expressed under the control of ciGal4 combined with the temperature sensitive tubGAL80ts. B, C At time 0, both ligands can be detected in the whole ci-Gal4 expression domain. B-B’’’ The HA signal of Ser-HA vanishes gradually within 24 hours. C-C’’’ In contrast, SerK2R-HA is detectable even after 72 hours of chase (yellow arrow), indicating that it is inefficiently degraded in comparison to Ser-HA
Fig. 5
Fig. 5
Analysis of the individual core Ks in the ICD of Ser. A, A’ Expression of Ser5R fails to induce ectopic expression of Wg and interrupts the endogenous expression of Wg in a manner comparable to SerK2R (red bracket, compare with Fig. 2D, D’). This indicates that it acts in a dominant-negative manner. (A’) Nevertheless, it is still located in intracellular punctae, suggesting that it is endocytosed. B Like in the case of SerK2R, the co-expression of Ser5R with Notch results in the mutual suppression of the individual phenotype (compare with Fig. 2E, E’). C, C’ Co-expression of Ser5R with Mib1 resulted in a weak activation of signalling, indicated by the weak ectopic activation of Wg close to the D/V boundary (arrow, quantification in K). D, D’ Expression of SerK2R5K induces an ectopic activation of Wg in a manner very similar to Ser. Note, that the anterior stripe is longer than in the case of Ser, indicating a slight stronger signalling ability (quantification in K). SerK2R-5K is also found in intracellular punctae (arrow in D’). E The re-introduction of K1362 into the ICD of SerK2R does not impact on its activity. SerK2RR1362K still displays the dominant-negative phenotype, similar to SerK2R (B, red bracket, compare with Fig. 2E, E’). F The replacement of K1276 by R in Ser produces an active ligand with a slightly higher cis-inhibitory effect, indicated by the absence of the anterior stripe of ectopic expression of Wg (yellow arrow and bracket, compare with Fig. 2C, C’). G Replacement of K1294 by R in Ser leads to a slightly more active ligand. The white arrow points to the anterior stripe of the ectopic Wg expression, which is slightly more prominent than that of Ser (quantification in K, compare with Fig. 2B, B’). H-H’’ The signalling activity and endocytosis of SerK1362R is strongly impaired. Yellow arrow in G points to the enlarged gap of endogenous Wg expression (yellow bracket). Note, that a slight ectopic activation of Wg expression close to the D/V-boundary is detectable in a fraction of discs (white arrow). This indicates that the signalling abilities are dramatically reduced, but not abolished and that SerK1362R is not acting in a dominant-negative manner, but possesses increased cis-inhibitory abilities (quantification in K). (H´´) Similar to SerK2R, SerK1362R is located mostly at the apical (yellow arrow) and the basal membrane (red arrow). a: apical; b: basal. I Co-expression of SerK1362R with Notch results in suppression of SerK1362R mediated CI and in a strong ectopic activation of ectopic Wg expression, comparable to that of co-expression of Notch with Ser (white arrow, compare with Fig. 2D). J Likewise, the Co-expression with Mib1 strongly enhance the signalling abilities of SerK1362R (arrows). K Quantification of the signalling and cis-inhibitory abilities of the Ser-variants with the exception of the dominant-negative acting variants (n= 5 discs/genotype). L Co-immunoprecipitation experiments (Co-IP) to analyse the binding of Ser, SerK2R, SerK1362R to V5-Mib1ΔR, a variant without the Ring Finger domain required for ubi. The results of the Co-IP indicates that all three Ser variants are able to interact with Mib1, as they are co-precipitate Mib1
Fig. 6
Fig. 6
Analysis of Ser- and SerK2R-variants with multiple K to R and R to K substitutions. A Diagram of the ICDs of Ser and SerK2R for orientation. B Simultaneous replacement of K1276 and K1294 by R led to a less active ligand (white arrow) with enhanced cis-inhibitory properties (yellow arrow, bracket). C Exchange of four out of five core K also led in each combination to an inactive ligand (see also Fig. S4L, M). D-F Reintroduction of four out of five core Ks resulted in ligands with different activities. SerK2RR1294,1362,1381,1385K was able to ectopically activate Wg only very weakly, close to the D/V boundary (D, white arrow). SerK2RR1276,1362,1381,1385K was no longer dominant-negative, but only cis-inhibitory (E, yellow arrow) and could not induce ectopic Wg expression. SerK2RR1276,1294,1362,1381K remained not functional, indicated by the lack of ectopic activation of Wg and strong CI (F, red bracket). G The reintroduction of alternative less conserved K1370 together with Ks 1276,1294,1362,1381 fully restores the activity of the ligand (white arrow, compare with F). H The re-introduction of K1349, which is similarly conserved than K1370, together with 1276,1294,1362,1381 resulted in a less active Ser variant, which only weakly activated Wg expression. I Expression of SerK2R6K, where K1370 is re-introduced with the five core Ks, results in a strong activation of ectopic Wg expression, comparable to SerK2R5K (compare with Fig. 5A). J Quantification of the signalling and cis-inhibitory activities of the variants with the exception of the dominant-negative acting variants (n= 5 discs/genotype)
Fig. 7
Fig. 7
Western Blot analysis of Ser variants, detected by an antibody directed against the HA tag,. A Ser runs in two bands in the WB (black and red arrow). Note, the dramatic increase in the intensity of the FMB in the case of SerK2R compared to Ser (Lane 1 and 2, red arrow). B Quantification of the intensity of the FMB (lower band) normalized to the Tubulin loading control (n=5, HA staining as in (A)). C Western-Blot analysis of additional Ser-variants, including SerK2R6K. Note, that the intensity of the FMB is reduced to the level of Ser, suggesting that the additional introduction of K1370 also restores bulk endocytosis (lane 3, compare with lane 1, quantification in B). D Western-Blot analysis of the expression of Ser and SerK2R in S2R+ cells. E, F WB analysing the expression of Ser in S2R+ cells in the absence (lane 1) and presence of increasing amount of Mib1 (lanes 2–4). Like in the disc cells, two main bands of Ser are present (arrows). Note, that the intensity of the FMB (red arrow) decreases with increasing amount of Mib1, suggesting that the corresponding fraction of Ser undergoes Mib1-mediated degradation. F Quantification of the intensity of the FMB of the Blot shown in (D), normalised to the Tubulin control. The experiment is repeated three times (n=3) with the 1: 3 relation of Ser: Mib1 (lane 4 in D)

References

    1. Seib E, Klein T. The role of ligand endocytosis in Notch signalling. Biol Cell. 2021. 10.1111/boc.202100009. - PubMed
    1. Kovall RA, Gebelein B, Sprinzak D, Kopan R. The canonical notch signalling pathway: structural and biochemical insights into shape, sugar, and force. Dev Cell. 2017;41:228–41. - PMC - PubMed
    1. Klein T. Wing disc development in the fly: the early stages. Curr Opin Genet Dev. 2001;11:470–5. - PubMed
    1. del Álamo D, Rouault H, Schweisguth F. Mechanism and significance of cis-inhibition in Notch signalling. Curr Biol. 2011;21:R40–47. - PubMed
    1. Vüllings N, Airich A, Seib E, Troost T, Klein T. Another tail of two sites: activation of the Notch ligand delta by Mindbomb1. BMC Biol. 2025. 10.1186/s12915-025-02162-6. - PMC - PubMed

LinkOut - more resources