Clinical Trial
. 2025 Oct 31;13(10):e012432.
doi: 10.1136/jitc-2025-012432.

Perioperative pembrolizumab in early-stage non-small cell lung cancer (NSCLC): conventional and distribution-based immune profiling of the tumor microenvironment and peripheral circulation

Affiliations
Clinical Trial

Perioperative pembrolizumab in early-stage non-small cell lung cancer (NSCLC): conventional and distribution-based immune profiling of the tumor microenvironment and peripheral circulation

Jingxuan Zhang et al. J Immunother Cancer. .

Abstract

Purpose: A recently published phase 2 neoadjuvant trial in patients with early-stage non-small cell lung cancer (NSCLC) (NCT02818920) evaluated the potential efficacy of pembrolizumab administration in the absence of chemotherapy. This communication reports on conventional and distribution-based immune profiling efforts in efforts to identify novel biomarkers predictive of benefit.

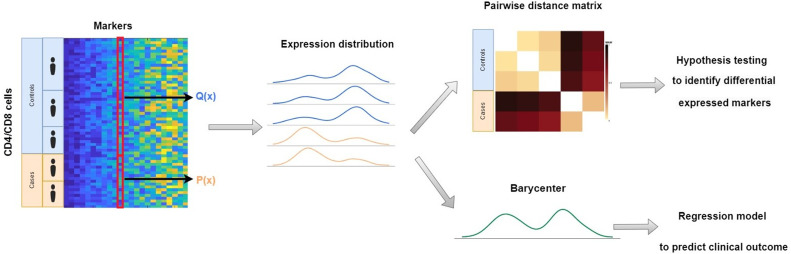
Methods: Patients with stage 1B-3A NSCLC received two cycles of pembrolizumab (P), followed by surgical resection of the remaining tumors (NCT02818920). Banked peripheral blood mononuclear cells (PBMCs) were analyzed at baseline and following the second dose of P. Resected tumors were disaggregated, and cells were viably cryopreserved. Based on pathologic examination of the tumors, patients were categorized as major pathologic responders (MPR; ≤10% viable tumor present), or non-MPR (>10% viable tumor present). High-parameter immune phenotyping by flow cytometry was performed on all available tumor and PBMC specimens, and results were expressed using both conventional phenotypic frequency analyses as well as a novel distribution-based biomarker identification strategy aimed at discovery of patterns associated with MPR.

Results: Conventional, frequency-based flow cytometric immune phenotyping of participant tumor microenvironments and PBMC revealed several MPR-associated trends, only a few of which reached statistical significance. The distribution-based biomarker identification strategy greatly enhanced the discovery of statistically significant cell types and patterns of change associated with MPR.

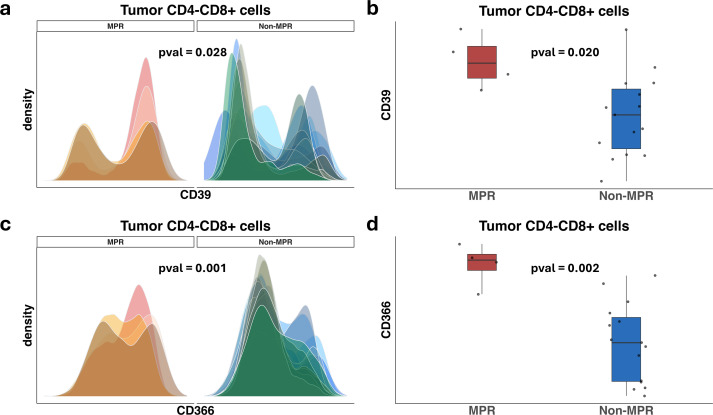
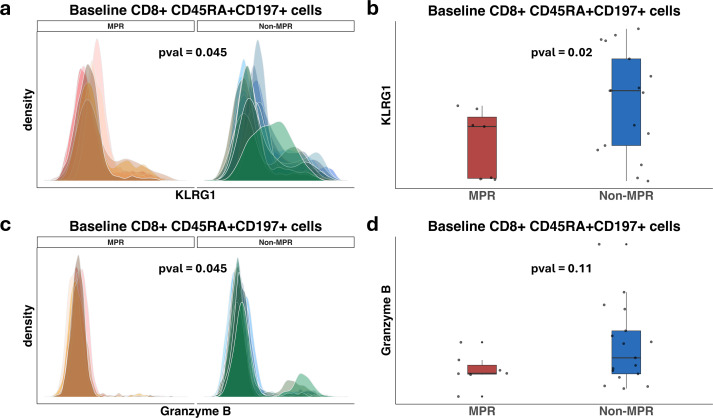
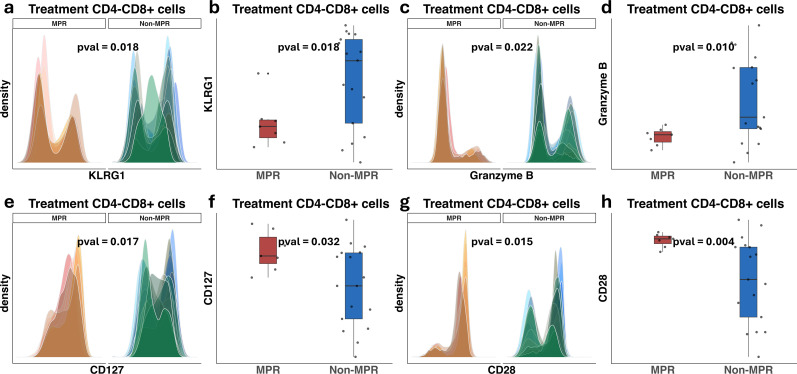
Conclusions: This novel, distribution-based analytic framework identified MPR-associated immune cell subsets in baseline PBMC that were not evident using conventional frequency-based immune profiling. Profiling the microenvironment of MPR-associated tumors revealed statistically significant distributional differences among highly expressed cellular markers on CD8+ cells.

Keywords: Biomarker; Immunotherapy; Lung Cancer; Major pathologic response - MPR.


Conflict of interest statement

Competing interests: None declared.

Figures

Figure 1
Figure 1. Conventional, frequency-based FCM immune profiling of the TME. EOMES (Eomesdermin), a T-box transcription factor; FCM, flow cytometry; HLA-DR, Human Leukocyte Antigen -DR isotype: KLRG1, killer cell lectin-like receptor subfamily G member 1; MPR, major pathologic responses; NK, natural killer; PD-1, programmed cell death protein 1; PR, pathologic response; SOR, suboptimal response; T-bet, a T-box expressed in T cells; TIM-3, T-cell immunoglobulin and mucin domain 3; TME, tumor microenvironment; Treg, regulatory T-cell; TRM, tissue resident memory.
Figure 2
Figure 2. Conventional, frequency-based FCM immune profiling of the baseline and post-therapy PBMC. FCM, flow cytometry; HLA-DR, Human Leukocyte Antigen - DR isotype; KLRG1, killer cell lectin-like receptor subfamily G member 1; MPR, major pathologic responses; PBMC, peripheral blood mononuclear cell; PD-1, programmed cell death protein 1; PR, pathologic response; SOR, suboptimal response; TIM-3, T-cell immunoglobulin and mucin domain 3; Treg, regulatory T cell.
Figure 3
Figure 3. Overview of the pipeline for cytoDE and prediction analysis. The pipeline consists of multiple sequential steps beyond preprocessing, manual gating of cytometry data. Raw cytometry data should be preprocessed, including quality control, compensation, and transformation to normalize signal intensities before being imported to the model. Then a computational algorithm will be implemented based on minimized aggregated Wasserstein metric across each marker within each cell subpopulation in order to detect distributional difference between individuals. Inferential permutation hypothesis testing will lead to identifying differentially expressed markers between different groups of individuals while a regression model is established to predict clinical outcomes. cytoDE, cytometric differential expression.
Figure 4
Figure 4. Tumor distributional-based test result. Subplots (a) and (c) display density plots of CD39 and CD366 expression within CD8+ cells in tumor samples, illustrating distinct expression distribution patterns between patients in the MPR and other/SOR groups. Subplots (b) and (d) use traditional boxplots to confirm that the means of marker expression differ significantly between the two groups. CD, cluster differentiation; MPR, major pathologic responses; SOR, suboptimal response.
Figure 5
Figure 5. Baseline PBMC distributional-based test result. Subplots (a) and (c) display density plots of KLRG1 and granzyme B expression within CD8+CD45RA+CD197+ cells in samples at baseline study, illustrating distinct expression distribution patterns between patients in the MPR and other/SOR groups. Subplots (b) and (d) use traditional boxplots to show the means of marker expression between the two groups. Although KLRG1 provides a consistency in the hypothesis testing conclusion based on the two subplots (a) and (b), granzyme B fails to be identified as the differentially expressed marker using only traditional analytic methods when comparing the first moment of the expression level. This might be because the only significant distinction occurred on the overlooked right region (high expression peak) but not the heavy weight on the left region (low expression peak). CD, cluster differentiation; KLRG1, killer cell lectin-like receptor subfamily G member 1; MPR, major pathologic responses; PBMC, peripheral blood mononuclear cell; SOR, suboptimal response.
Figure 6
Figure 6. Treatment PBMC distributional-based test result. Subplots (a) and (c) display density plots of KLRG1 and granzyme B expression within CD8+ cells in samples after treatment study, illustrating distinct expression distribution patterns between patients in the MPR and other/SOR groups. Subplots (b) and (d) use traditional boxplots to confirm that the means of marker expression differ significantly between the two groups. Subplots (e) and (g) display density plots of two additional differentially expressed markers, CD127 and CD28, within CD8+ cells in samples after treatment study, illustrating distinct expression distribution patterns between patients in the MPR and other/SOR groups. Subplots (f) and (h) are the corresponding boxplots based on the expression means across each individual in order to confirm that the means of marker expression differ significantly between the two groups. CD, cluster differentiation; KLRG1, killer cell lectin-like receptor subfamily G member 1; MPR, major pathologic responses; PBMC, peripheral blood mononuclear cell; SOR, suboptimal response.
Figure 7
Figure 7. Predictive analysis. Subplot (a) displays the ROC curve of the predictive regression model using baseline data for single marker within certain cell subpopulation, while subplot (b) displays the ROC curve of the model using both baseline and predictive data for single marker within the cell subpopulation. AUC, area under the curve; CD, cluster differentiation; HLA-DR, Human Leukocyte Antigen -DR isotype; Tbet, T-box expressed in T cells, ROC, receiver operating curve; Treg, regulatory T-cell.

References

    1. Felip E, Altorki N, Zhou C, et al. Overall survival with adjuvant atezolizumab after chemotherapy in resected stage II-IIIA non-small-cell lung cancer (IMpower010): a randomised, multicentre, open-label, phase III trial. Ann Oncol. 2023;34:907–19. doi: 10.1016/j.annonc.2023.07.001. - DOI - PubMed
    1. Wakelee H, Liberman M, Kato T, et al. Perioperative Pembrolizumab for Early-Stage Non-Small-Cell Lung Cancer. N Engl J Med. 2023;389:491–503. doi: 10.1056/NEJMoa2302983. - DOI - PMC - PubMed
    1. Provencio M, Nadal E, González-Larriba JL, et al. Perioperative Nivolumab and Chemotherapy in Stage III Non-Small-Cell Lung Cancer. N Engl J Med. 2023;389:504–13. doi: 10.1056/NEJMoa2215530. - DOI - PubMed
    1. Heymach JV, Harpole D, Mitsudomi T, et al. Perioperative Durvalumab for Resectable Non–Small-Cell Lung Cancer. N Engl J Med . 2023;389:1672–84. doi: 10.1056/NEJMoa2304875. - DOI - PubMed
    1. Forde PM, Spicer J, Lu S, et al. Neoadjuvant Nivolumab plus Chemotherapy in Resectable Lung Cancer. N Engl J Med. 2022;386:1973–85. doi: 10.1056/NEJMoa2202170. - DOI - PMC - PubMed

Publication types

MeSH terms

Substances