. 2025 Nov 3;6(1):94.
doi: 10.1186/s43556-025-00334-y.

Longitudinal changes in the genetic and environmental influences on DNA methylation linked to obesity measures: a 5-year twin study

Affiliations

Longitudinal changes in the genetic and environmental influences on DNA methylation linked to obesity measures: a 5-year twin study

Xuanming Hong et al. Mol Biomed. .

Abstract

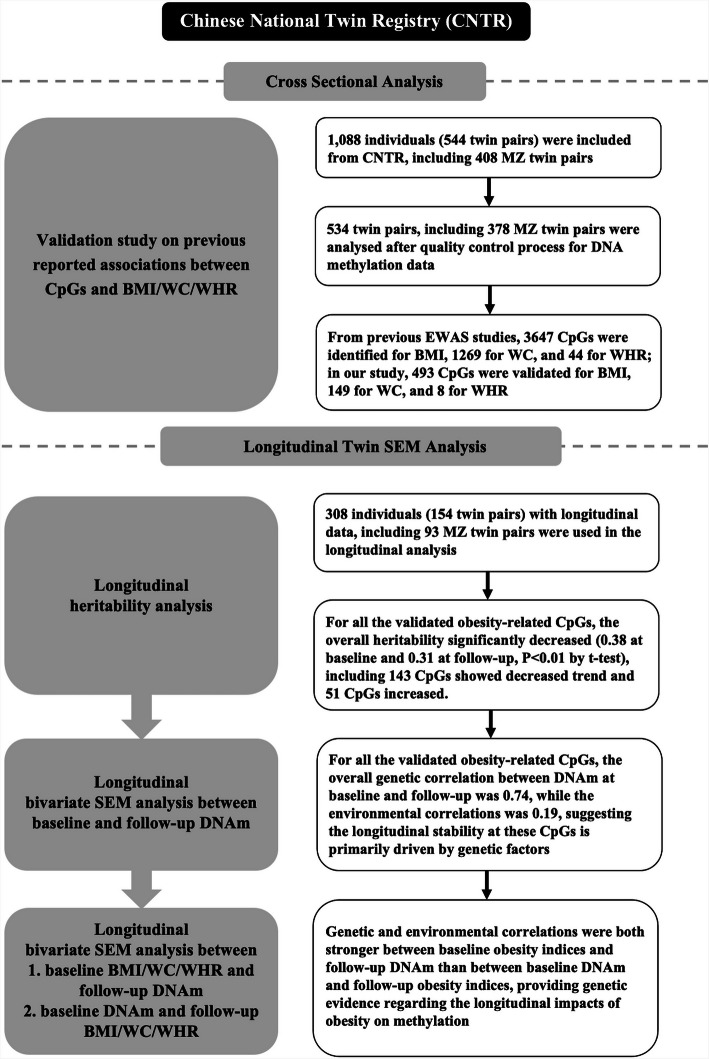
The reproducibility of obesity-related DNA methylation (DNAm) sites (CpGs) remains low across studies, and the underlying mechanisms involving genetic and environmental contributions require further investigation. In this study, we systematically searched PubMed, EMBASE, and EWAS catalogue for CpGs associated with BMI, waist circumference (WC), and waist-to-hip ratio (WHR) from previous publications, identifying 29 studies with 2,603/892/28 CpGs for BMI/WC/WHR, respectively. Then, based on 1,074 twins from Chinese National Twin Registry, 493/149/8 CpGs were validated for BMI/WC/WHR, controlling for genetic factors. Following this, within the full twin population and a subsample of 308 twins with longitudinal data collected over a 5-year period, structural equation models (SEMs) were used to assess the heritability of CpGs and how it changes over time. The overall heritability of these obesity-related CpGs was relatively high, averaging 0.34 in full twin population, which decreased from 0.38 at baseline to 0.31 at follow-up. Bivariate SEMs were employed to investigate the genetic/environmental effects behind the longitudinal stability of DNAm. Genetic correlations between baseline and follow-up DNAm levels were high (mean = 0.74), whereas environmental correlations were relatively low (mean = 0.19), suggesting the role of genetic influence on the stability of DNAm at these CpGs. For longitudinal cross-relationships between obesity indicators and DNAm, considerably higher genetic contributions from baseline obesity traits to follow-up DNAm (mean = 0.15) was observed, compared to the baseline DNAm's genetic influences on follow-up obesity indices (mean = 0.09, P < 0.01). These findings provide genetic evidence for obesity-related DNAm and demonstrate that the genetic effects of obesity have a persistent longitudinal influence on DNAm.

Keywords: DNA methylation; Genetic correlations; Longitudinal study; Obesity; Twin study.


Conflict of interest statement

Declarations. Ethics approval and consent to participate: This study was approved by the Biomedical Ethics Committee at Peking University, Beijing, China (IRB00001052-13022, IRB00001052-14021, IRB00001052-22032). Informed consent was obtained from all recruited participants. Consent for publication: The authors are consent to the submission and publication of this paper. Competing interests: The authors declare that they have no competing interests.

Figures

Fig. 1
Fig. 1
Characteristics and overlap of CpGs showing significance in the validation analysis. CpGs significantly associated with (a) BMI, (b) WC, (c) WHR, and (d) all obesity-related indices. CpG indicates 5′—cytosine—phosphate—guanine—3′ in DNA; BMI, body mass index; WC, waist circumference; WHR, waist to hip ratio
Fig. 2
Fig. 2
Genetic and environmental influences and distributions of obesity-related CpGs in full analysis population. (a) Histograms of univariate SEM model estimates for obesity-related CpGs at full analysis population (n = 1058); (b) Distribution of DNAm sites grouped based on obesity traits (n = 1058); (c) Distribution of DNAm sites grouped based on heritability (n = 1058). CpG indicates 5′—cytosine—phosphate—guanine—3′ in DNA; h2, heritability; e2, environmental components; BMI, body mass index; WC, waist circumference; WHR, waist to hip ratio
Fig. 3
Fig. 3
Genetic and environmental influences of obesity-related CpGs across 5 years. (a) Histograms of univariate SEM model estimates for obesity-related CpGs at baseline (n = 308); (b) Histograms of univariate SEM model estimates for obesity-related CpGs at follow-up (n = 308); (c) Sankey chart of longitudinal changes in heritability for obesity-related CpGs at follow-up (n = 308). CpG indicates 5′—cytosine—phosphate—guanine—3′ in DNA; h2, heritability; e2, environmental components
Fig. 4
Fig. 4
Changes in genetic and environmental variance of obesity-related CpGs across 5 years. (a) Sankey chart of longitudinal changes in genetic components for obesity-related CpGs (n = 308); (b) Sankey chart of longitudinal changes in environmental components for obesity-related CpGs (n = 308)
Fig. 5
Fig. 5
Longitudinal genetic and environmental correlations between obesity traits and DNAm and distributions for CpGs have different genetic correlations with obesity traits. (a) Longitudinal genetic correlations between obesity traits and DNAm for obesity-related CpGs (n = 308), "A" in the circle denotes the genetic contributions; (b) Longitudinal environmental correlations between obesity traits and DNAm for obesity-related CpGs (n = 308), "E" in the circle denotes the environmental contributions; (c) Distribution of DNAm sites grouped based on longitudinal genetic correlations with obesity traits (n = 308): Ra1: genetic correlations between baseline obesity traits and follow-up DNAm levels; Ra2: genetic correlations between baseline DNAm levels and follow-up obesity traits. DNAm, DNA methylation; Ra, genetic correlation; Re environmental correlation
Fig. 6
Fig. 6
Potential explanations from association analyses. Figure a to c illustrate the potential results from association analyses. a The association between CpG and obesity traits is independent of genetic effects, as indicated by CpGs that show significance in both full population and MZ discordant analysis; (b) Genetic effects primarily drive the association between CpG and obesity traits, as evidence by CpGs that exhibit significance only in full population analysis; (c) Genetic effects confound the association between the CpG site and the obesity traits, as suggested by CpGs that show significance only in MZ discordant analysis. "A" denotes the genetic contributions
Fig. 7
Fig. 7
Study flow chart. CpG indicates 5′—cytosine—phosphate—guanine—3′ in DNA; BMI, body mass index; WC, waist circumference; WHR, waist to hip ratio; MZ, monozygotic twins; DNAm, DNA methylation; EWAS, epigenome-wide association study

References

    1. Zamani N, Brown CW. Emerging roles for the transforming growth factor-beta superfamily in regulating adiposity and energy expenditure. Endocr Rev. 2011;32(3):387–403. 10.1210/er.2010-0018. - PMC - PubMed
    1. Pan XF, Wang L, Pan A. Epidemiology and determinants of obesity in China. Lancet Diabetes Endocrinol. 2021;9(6):373–92. 10.1016/S2213-8587(21)00045-0. - PubMed
    1. Yuan Y, Xu P, Jiang Q, Cai X, Wang T, Peng W, et al. Exercise-induced alpha-ketoglutaric acid stimulates muscle hypertrophy and fat loss through OXGR1-dependent adrenal activation. Embo J. 2021;40(14):e108434. 10.15252/embj.2021108434. - PMC - PubMed
    1. Sun D, Zhang T, Su S, Hao G, Chen T, Li QZ, et al. Body mass index drives changes in DNA methylation: a longitudinal study. Circ Res. 2019;125(9):824–33. 10.1161/CIRCRESAHA.119.315397. - PMC - PubMed
    1. Yuan X, Tsujimoto K, Hashimoto K, Kawahori K, Hanzawa N, Hamaguchi M, et al. Epigenetic modulation of Fgf21 in the perinatal mouse liver ameliorates diet-induced obesity in adulthood. Nat Commun. 2018;9(1):636. 10.1038/s41467-018-03038-w. - PMC - PubMed

Publication types

LinkOut - more resources