. 2025 Nov 17;5(11):101220.
doi: 10.1016/j.crmeth.2025.101220. Epub 2025 Nov 4.

EyaHOST, a modular genetic system for investigation of intercellular and tumor-host interactions in Drosophila melanogaster

Affiliations

EyaHOST, a modular genetic system for investigation of intercellular and tumor-host interactions in Drosophila melanogaster

José Teles-Reis et al. Cell Rep Methods. .

Abstract

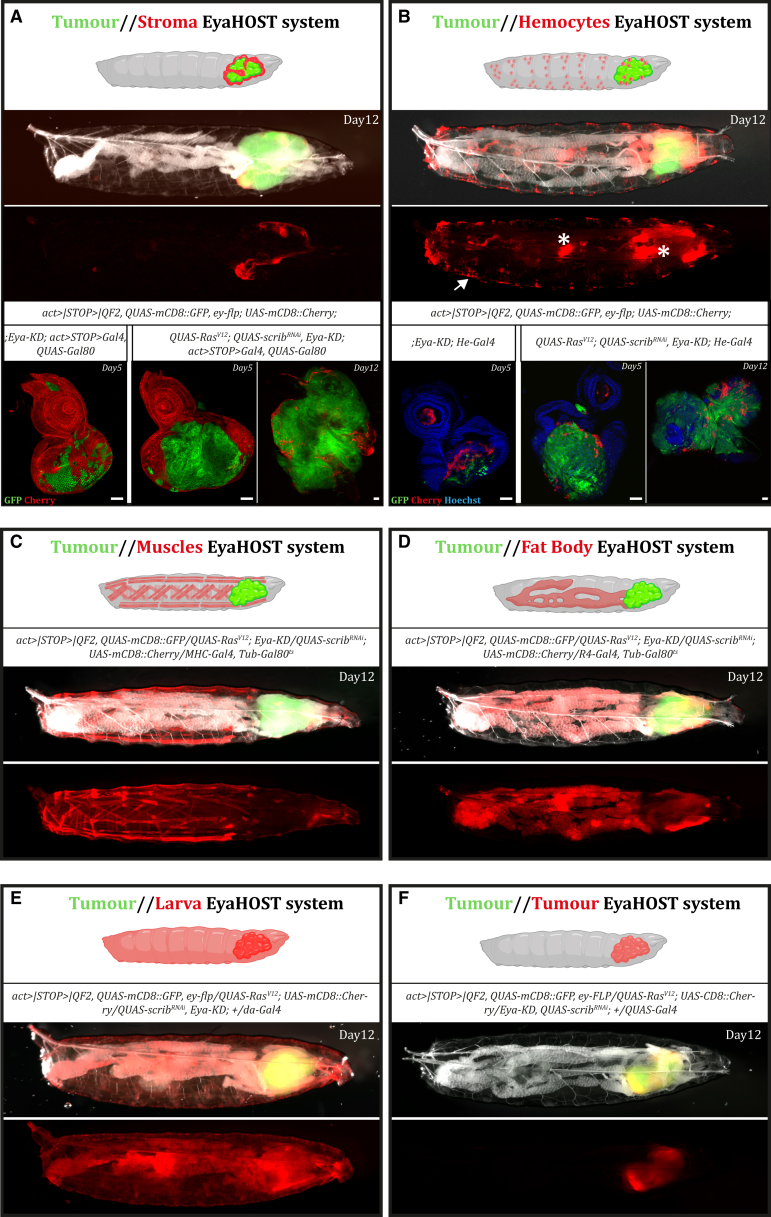
Studying intercellular and interorgan interactions in animal models is key to understanding development, physiology, and disease. We introduce EyaHOST, a system for clonal combinatorial loss- and gain-of-function genetics in fluorescently labeled cells under QF2-QUAS eya promoter control. Distinct from mosaic analysis with a repressible cell marker (MARCM), it reserves the use of genome-wide GAL4-UAS tools to manipulate any host tissue. EyaHOST-driven RasV12 overexpression with scribble knockdown recapitulates key cancer features, including systemic catabolic switching and organ wasting. We demonstrate effective tissue-specific manipulation of host compartments, including homotypic epithelial neighbors, immune cells, fat body, and muscle. Organ-specific inhibition of autophagy or stimulation of growth signaling via PTEN knockdown in fat body or muscle prevents cachexia-like wasting. Additionally, tumors trigger caspase-driven apoptosis in the neighboring epithelium, and blocking apoptosis with p35 enhances tumor growth. EyaHOST provides a modular platform to dissect mechanisms of intercellular and interorgan communication under physiological or disease conditions.

Keywords: CP: cancer biology; CP: genetics; Drosophila; QF2; Ras; Scrib; apoptosis-induced proliferation; cachexia; cancer model; cell competition; tumor-host; tumorigenesis.


Conflict of interest statement

Declaration of interests The authors declare no competing interests.

Figures

None
Graphical abstract
Figure 1
Figure 1
EyaHOST system allows the independent genetic manipulation of two cell populations in the EAD (A) Diagram comparing the genetic design strategies of commonly used EAD clonal system EyMARCM and EyaHOST. The diagram shows the different transgenes inserted along the X, II, and III chromosomes of Drosophila. Briefly, the EyMARCM system utilizes the FLP-FRT system and mitotic recombination for RasV12scrib−/− tumor generation. Although highly effective, it requires four transgenes and occupies significant chromosome space, leaving only one homologous X chromosome available for additional genetic manipulation. In contrast, the EyaHOST system requires only two transgenes for clone generation, freeing one homologous II chromosome and both homologous III chromosomes for further genetic manipulation. Clone generation is achieved through tissue-specific activation of an Act-KDRT-STOP-KDRT-QF2 cassette via the KD-KDRT system, driven by the eya promoter. This system also employs the QF2-QUAS system for tumor generation, which allows for host-independent manipulation using the widely adopted GAL4-UAS system. The EyaHOST system is activated by crossing the pickup and tester fly lines. The tester line is designed to have the III chromosome free for host tissue-specific GAL4 transgenes, while the pickup line can accommodate any desired RNAi, overexpression, reporter, or other transgenes on chromosomes II and III. (B and C) Confocal images and percentage of activated clonal WT cell populations in the EAD of the EyMARCM and EyaHOST systems, respectively. Hoechst is shown in blue, GFP in green, Cherry in red. (C) As shown by Cherry expression, the EyaHOST system enables independent GAL4-UAS manipulation of the neighboring cell population. Specifically, an Act-FRT-STOP-FRT-GAL4 cassette is activated via the FLP-FRT system under the control of the eya promoter, leading to GAL4 expression across the entire disc. Subsequently, QUAS-GAL80 expression inhibits GAL4 activity within the QF2-expressing population. (D and E) GFP-positive RasV12, scribRNAi tumors (green) generated through the EyaHOST system, (D) stained for pERK (red) or (E) stained for apical/basal polarity gene protein Scrib (red). Samples shown are EAD of animals dissected at day 5 AEL. Scale bars, 50 μm.
Figure 2
Figure 2
EyaHOST RasV12, scribRNAi tumors recapitulate known tumor hallmarks and paraneoplastic effects (A) RasV12, scrib tumor volume changes over time for the EyMARCM system using two different scrib alleles, scrib1 (pink) and scrib2 (blue), as well as for EyaHOST tumors (green). EyMARCM data beyond day (D) 10 are not shown due to high larval mortality at later time points. Data are presented as means, with error bars representing the standard deviation (SD). (B) Pupariation percentage comparison over time between EyMARCM system, scrib1 (pink), scrib2 (blue) alleles, and EyaHOST animals (green). Data are presented as means, with error bars representing the SD. (C) Confocal images of EAD with GFP-positive WT clones (left and green) or RasV12, scribRNAi tumors (right and green), stained for Hoechst (blue) and Elav (pink). Scale bars, 50 μm. In the close-up image, the clone border is marked by a line, with green indicating the clone side and white representing the neighboring cells. Asterisk marks the inside of the clone. (D) Microscope images of larval cephalic complexes (mouth hook, EAD, and CNS) from WT at D5 AEL and RasV12, scribRNAi tumors at D5 or D10 AEL. Quantification shows the frequency of invasion of GFP-positive cells in the optic lobe (OL) and ventral nerve cord (VNC). Scale bars, 50 μm. Insets demonstrate the absence of GFP-positive cell nuclei in the OL at D5 in WT, contrasted with their presence in RasV12, scribRNAi tumors at D5. By D10, the optic lobes are completely invaded by RasV12, scribRNAi tumor cells, which also extend into the VNC (arrowheads). (E) Confocal images of the fat body (top) and muscle (bottom) of WT D5 and RasV12, scribRNAi tumors in D5, D12–14, and D18 animals. Fat body preparations were stained for LipidTOX (red) and Hoechst (blue), and muscle fillets were stained for actin using phalloidin 594 conjugate. Scale bars, 50 μm.
Figure 3
Figure 3
EyaHOST RasV12, scribRNAi tumors recapitulate the known ectopic activation of the JNK, JAK-STAT, and Hippo pathways (A–C) Confocal images of EAD from WT and RasV12, scribRNAi EyaHOST larvae at D5. GFP (green) marks WT cells or RasV12, scribRNAi EyaHOST tumor cells, while pathway-specific markers pJNK, STAT-GFP, and Kibra-LacZ (pink) highlight the activation of the JNK, JAK-STAT, and Hippo pathways, respectively. Scale bars, 50 μm.
Figure 4
Figure 4
The modularity of the EyaHOST system enables the independent manipulation of any host tissue within a tumor context (A–F) Stereoscope images of differently built EyaHOST avatars with QF2-QUAS-driven RasV12, scribRNAi tumor-bearing larva at D12. These avatars utilize GAL4-UAS genetic manipulation to target specific host tissues, as indicated by Cherry expression (red): (A) neighboring stromal cells, (B) hemocytes, (C) muscle, (D) fat body, and (E) the entire organism. (F) A tool designed for autonomous tumor manipulation within the same genetic background. Insets in (A) and (B) display WT D5 EAD and D5 and D12 tumors from the stromal and hemocyte avatars, respectively. Asterisks in (B) indicate ectopic expression of the He-GAL4 driver in the gut and salivary glands. Arrow points to hemocytes. Scale bars, 50 μm.
Figure 5
Figure 5
Tumor-induced host autophagy is recapitulated in the EyaHOST system and organ-specific autophagy inhibition prevents tissue atrophy (A–C) (A) Representative confocal images of EAD, fat body, muscles, and gut in WT D5 larvae and RasV12, scribRNAi tumor-bearing larvae at D5 and D8. Autophagy induction is indicated by ChAtg8 puncta (red) in various tissues. GFP-labeled RasV12, scribRNAi tumors (green) are shown in the EAD column. Samples are counterstained with Hoechst (blue) for nuclei and actin (green) for muscle tissue. The percentage of samples showing ChAtg8 puncta is quantified for each tissue type. Scale bars, 50 μm. (B) and (C) Stereoscope images of tumor-bearing larvae with Atg1 knockdown in the fat body (B) and muscle (C). Quantifications of adipose tissue area and muscle area are provided below the images. Adipose tissue area and muscle area quantifications are also shown for pten knockdown in fat body and muscle (images shown in Figure S6). Insets in (C) show a close up of muscle structures. Statistical significance between groups was determined using the Welch’s t test: ∗p ≤ 0.0332, ∗∗p ≤ 0.0021, ∗∗∗p ≤ 0.0002. Scale bars, 350 μm. Data are presented as means, with error bars representing the SD.
Figure 6
Figure 6
Microenvironmental generation of p35-mediated undead cells promotes tumor development (A) Microenvironmental death prevention through p35 inhibition of Drice and Dcp-1. Representative microscope images of EAD at D5 control and p35 microenvironment overexpression for WT and RasV12, scribRNAi tumor conditions. WT clones and tumors are GFP labeled (green) and stained for cDcp1 (magenta). Arrowheads indicate cytoplasmic cDcp1 accumulation in undead cells. Insets provide magnified views of the regions marked with dashed lines. Quantification of cell death, shown as the percentage of cDcp1-positive volume in clones and neighboring tissue, is presented alongside volume measurements of clones and adjacent tissue. Statistically significant differences between groups for clone volume were assessed with a one-way ANOVA with a post-hoc Tukey’s multiple comparison test, and differences in death ratio were tested with a Kruskal-Wallis and Dunn’s multiple comparison test: not significant (ns), ∗∗p ≤ 0.0021, ∗∗∗p ≤ 0.0002, ∗∗∗∗p ≤ 0.0001. Scale bars, 50 μm. Data are presented as means, with error bars representing the SD. (B) Microenvironmental death prevention through depletion of hid or Diap1-mediated inhibition of Dronc. Representative microscope images of EAD at D5 with microenvironmental CherryRNAi control and hidRNAi for WT and RasV12, scribRNAi tumor conditions. WT clones and tumors are GFP labeled (green) and stained for cDcp1 (magenta). Statistically significant differences between groups were assessed with a Kruskal-Wallis and Dunn’s multiple comparison test: not significant (ns), ∗∗p ≤ 0.0021, ∗∗∗∗p ≤ 0.0001. Scale bars, 50 μm. Data are presented as means, with error bars representing the SD.

Update of

References

    1. Bilder D., Irvine K.D. Taking Stock of the Drosophila Research Ecosystem. Genetics. 2017;206:1227–1236. doi: 10.1534/genetics.117.202390. - DOI - PMC - PubMed
    1. Golic K.G., Lindquist S. The FLP recombinase of yeast catalyzes site-specific recombination in the Drosophila genome. Cell. 1989;59:499–509. - PubMed
    1. Theodosiou N.A., Xu T. Use of FLP/FRT system to study Drosophila development. Methods. 1998;14:355–365. doi: 10.1006/meth.1998.0591. - DOI - PubMed
    1. Xu T., Rubin G.M. Analysis of genetic mosaics in developing and adult Drosophila tissues. Development. 1993;117:1223–1237. doi: 10.1242/dev.117.4.1223. - DOI - PubMed
    1. Weasner B.M., Zhu J., Kumar J.P. FLPing Genes On and Off in Drosophila. Methods Mol. Biol. 2017;1642:195–209. doi: 10.1007/978-1-4939-7169-5_13. - DOI - PMC - PubMed

Substances