. 2025 Nov 6;10(1):363.
doi: 10.1038/s41392-025-02452-z.

CDK7-targeted therapy effectively disrupts cell cycle progression and oncogenic signaling in head and neck cancer

Affiliations

CDK7-targeted therapy effectively disrupts cell cycle progression and oncogenic signaling in head and neck cancer

María Otero-Rosales et al. Signal Transduct Target Ther. .

Abstract

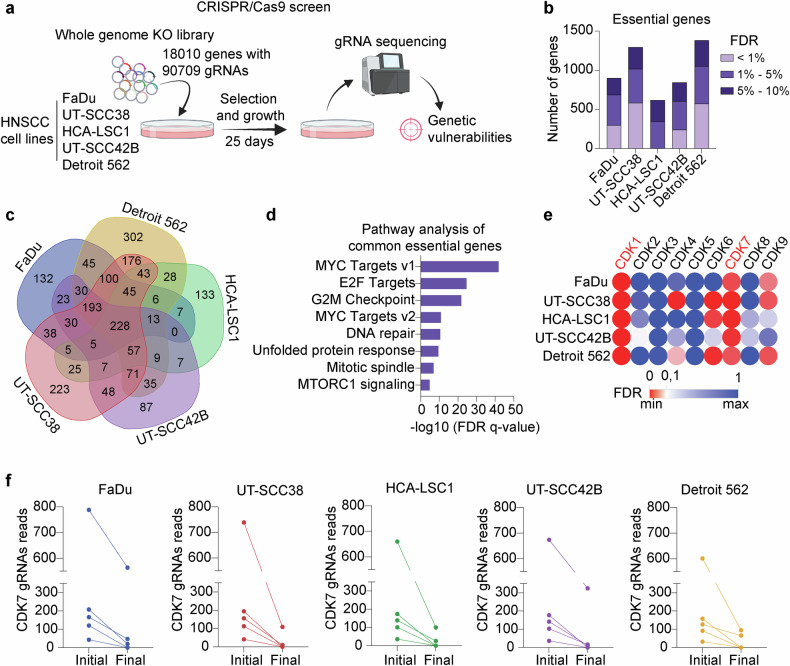
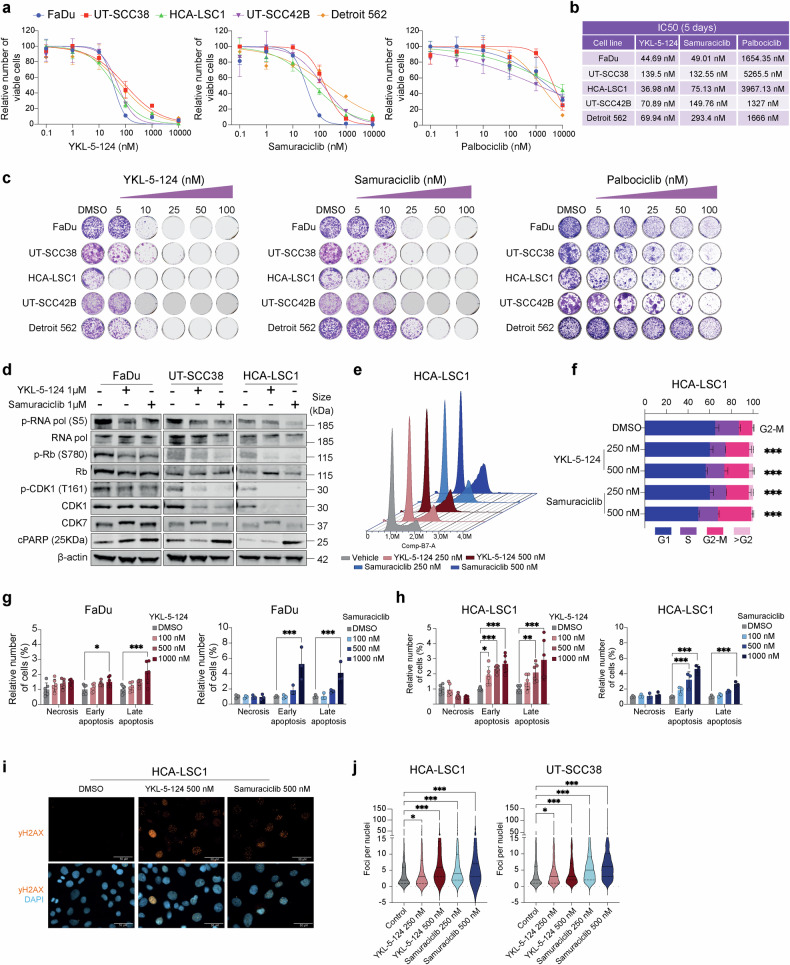
Head and neck squamous cell carcinoma (HNSCC) remains a prevalent and aggressive malignancy, characterized by a lack of targeted therapies and limited clinical benefits. Here, we conducted an optimized whole-genome CRISPR screen across five HNSCC cell lines aimed at identifying actionable genetic vulnerabilities for rapid preclinical evaluation as novel targeted therapies. Given their critical role in cancer, cyclin-dependent kinases (CDKs) were prioritized for further investigation. Among these, CDK7 was identified as an essential and targetable gene across all five cell lines, prompting its selection for in-depth functional and molecular characterization. Genetic and pharmacological inhibition of CDK7 significantly and consistently reduced tumor cell proliferation due to generalized cell cycle arrest and apoptosis induction. Additionally, CDK7 knockout (KO) and selective inhibitors (YKL-5-124 and samuraciclib) demonstrated potent antitumor activity, effectively suppressing tumor growth in HNSCC patient-derived organoids (PDOs), as well as in both cell line- and patient-derived xenograft (PDX) mouse models with minimal toxicity. Mechanistically, CDK7 inhibition led to a broad downregulation of gene sets related to cell cycle progression and DNA repair, and significantly reduced the transcription of essential genes and untargetable vulnerabilities identified by our CRISPR screen. These findings highlight CDK7 as a promising therapeutic target for HNSCC. Our study provides strong evidence of the robust antitumor activity of CDK7-selective inhibition in disease-relevant preclinical models, strongly supporting its progression to clinical testing.


Conflict of interest statement

Competing interests: K.T. is a shareholder of and has received research funding from Storm Therapeutics Ltd. All the other authors declare that they have no competing interests.

Figures

Fig. 1
Fig. 1
Whole-genome CRISPR screen uncovers genetic essentialities in HNSCC cell lines. a Schematic diagram depicting the experimental workflow of the functional CRISPR/Cas9 KO screen performed in a panel of five different HNSCC cell lines. Created in https://BioRender.com. b Bar graph showing the number of essential genes identified in each HNSCC cell line, categorized by FDR. c Venn diagram illustrating the overlap of essential genes across all five HNSCC cell lines tested (FDR < 0.10). d Pathway analysis of genes commonly essential across all HNSCC cells. e Heat map displaying the essentiality of genes coding for CDKs, based on FDR. f Line graph showing gRNAs counts of CDK7 gene at the initial (day 0) and final time points (day 25) of the screen for each cell line
Fig. 2
Fig. 2
Genetic validation of CDK7 essentiality in HNSCC cells. a Western Blot analysis displaying CDK7 protein levels across our panel of HNSCC cell lines, with β-actin serving as the loading control. b Bar graph showing CDK7 protein levels quantified as fluorescent IRDye intensity across HNSCC cell lines, normalized to β-actin levels and relative to the lowest-expressing line (UT-SCC38). c Western Blot analysis of CDK7 expression levels in FaDu, UT-SCC38, and HCA-LSC1 cell lines transduced with two independent sgRNAs to knockout CDK7 gene (KO1 and KO2) or control cells transduced with the empty vector, and β-actin protein as the loading control. d Schematic diagram depicting the experimental workflow for the in vitro competitive proliferation assays. Created in https://BioRender.com. eg Bar graphs showing the percentage of CDK7 KO cells harboring ZsG protein over different time points in FaDu (e), UT-SCC38 (f), and HCA-LSC1 (g) cell lines (***p < 0.001. Error bars, mean + SD of at least three replicates, Two-way ANOVA test). h Western blot analysis of the indicated CDK7 targets in empty vector- and CDK7 KO-transduced HNSCC cell lines, with β-actin protein serving as the loading control. i Heatmap illustrating the fluorescent IRDye quantification of the protein bands from (h) normalized to β-actin and relative to the empty control condition
Fig. 3
Fig. 3
Functional characterization of CDK7 pharmacological inhibition in HNSCC cell lines. a Measurement of cell viability in our panel of five different HNSCC cell lines treated with increasing concentrations of the CDK7-selective inhibitors YKL-5-124 and samuraciclib, and compared to the CDK4/6 inhibitor palbociclib. Four replicates per condition. Data shown as average + SD. b Table summarizing average IC50 values for each cell line treated with the aforementioned compounds (n ≥ 2). c Colony formation assays with increasing concentrations of YKL-5-124, samuraciclib, and palbociclib in the indicated HNSCC cell lines. d Western Blot analysis of protein changes in the indicated CDK7 targets and cleaved PARP (cPARP) in three different HNSCC cell lines treated with either vehicle (DMSO), YKL-5-124 (1 μM), or samuraciclib (1 μM) for 24 h. β-actin protein was used as the loading control. e Flow cytometry analysis of cell cycle changes in HCA-LSC1 cells treated with the indicated doses of YKL-5-124 and samuraciclib for 48 h. Two replicates per condition. f Percentage of cells in each cell cycle phase shown in (e) are represented as a stacked barplot ± SD. Only significant accumulation of cells in a cell cycle phase is indicated. Statistical significance was calculated using two-way ANOVA Dunnett’s multiple comparisons test. ***p < 0.001. g, h Flow cytometry analysis of apoptosis and necrosis in the indicated HNSCC cell lines upon treatment for 48 h with increasing concentrations of either YKL-5-124 or samuraciclib. Two replicates per condition. Statistical significance was calculated using two-way ANOVA Dunnett’s multiple comparisons test. *p < 0.05; ***p < 0.001. i, j Analysis of γH2AX foci in HNSCC cells upon 48 h exposure to YKL-5-124 or samuraciclib by immunofluorescence (IF) microscopy. i Representative 20x images of HCA-LSC1 DAPI-stained nuclei (in blue) and γH2AX foci (in orange) (scale bar, 50 μm). j Violin plot showing γH2AX foci per nuclei in each condition. At least five field images were counted (≥400 nuclei). Statistical significance was calculated using two-way ANOVA Dunnett’s multiple comparisons test. *p < 0.05; ***p < 0.001
Fig. 4
Fig. 4
Global transcriptional changes and a common downregulated profile in FaDu cells caused by CDK7 inhibition. a, b Volcano plots illustrating differentially expressed genes after 48 h of treatment with either YKL-5-124 (a) or samuraciclib (b) at 250 nM (padj <0.05, log2fc < −0.5 or log2fc > 0.5). To enhance clarity, ribosomal coding genes were filtered out. c, d Venn diagram showing the unique and overlapping genes that were found downregulated (c) and upregulated (d) upon YKL-5-124 and samuraciclib treatment (padj<0.01, log2fc < −0.5 or log2fc > 0.5). e Reactome pathway analysis of the common downregulated (blue bars) and common upregulated (red bars) genes by both CDK7 inhibitors. f Balloon plot displaying Gene Set Enrichment Analysis of genes downregulated (blue color) or upregulated (red color) by either YKL-5-124 or samuraciclib. g Heatmap depicting the subsets of common essential genes identified by our CRISPR screen (FDR < 0.25) that were found commonly significantly upregulated (in red) or downregulated (in blue) by both CDK7 inhibitors, as compared to control DMSO-treated FaDu cells. Differential gene expression changes are shown as z-score of log2(CPM)
Fig. 5
Fig. 5
Impact of CDK7 inhibition on in vivo xenograft models. a Tumor growth of FaDu and HCA-LSC1 cell lines with CDK7 KO or empty vector (n = 12 tumors per group for FaDu xenografts, and n = 7 tumors per group for HCA-LSC1 xenografts). Data shown as mean ± SEM. Statistic two-way ANOVA, uncorrected Fisher’s LSD, ***p < 0.001. b Box plots representing final tumor volumes of CDK7 KO or empty vector groups. Unpaired t-test, ***p < 0.001. c, d Schematic representation of YKL-5-124 (c) and samuraciclib (d) testing in vivo. Created in https://BioRender.com. e, f Tumor growth of FaDu and HCA-LSC1 cell lines in presence of vehicle/YKL-5-124 (n = 12 tumors per treatment condition) (e) or vehicle/samuraciclib (n = 12 tumors per condition) (f) treatment for 12 days. Arrows indicate start of treatment. Data shown as mean ± SEM. Statistic two-way ANOVA, uncorrected Fisher’s LSD, ***p < 0.001. g Box plots representing final tumor volumes among the different experimental groups within pharmacological CDK7 inhibition experiments. Unpaired t-test, ***p < 0.001
Fig. 6
Fig. 6
Impact of selective CDK7 inhibition in a HNSCC patient-derived xenograft (PDX) model. a Schematic representation of the experimental procedure performed in a HNSCC PDX model. Created in https://BioRender.com. b Tumor growth curves of PDX-bearing mice treated with vehicle (control), samuraciclib, or YKL-5-124. Data shown as mean ± SEM (*p < 0.05; **p < 0.01; ***p < 0.001, two-way ANOVA). c Principal component analysis (PCA) of RNA-seq data from mice PDX after 5 days of treatment. d, e Transcriptomic response to samuraciclib (d) and YKL-5-124 (e) treatment: volcano plot showing differentially expressed genes (middle panel), with Hallmark pathway enrichment of downregulated genes (left side) and upregulated genes (right side). f Representative immunohistochemistry images of Ki67 and phospho-histone H3 (pH3) staining in control- and CDK7 inhibitor-treated PDX tumors (scale bar, 100 μm). g QuPath quantification of Ki67- and pH3 as the percentage of positive cells in control and treated tumors. Data shown as mean ± SD (*p < 0.05; **p < 0.01; ***p < 0.001, two-way ANOVA)
Fig. 7
Fig. 7
Therapeutic evaluation of CDK7-selective inhibitors in HNSCC PDOs. a Representative images of CDK7 expression in formed HNSCC PDOs analyzed by immunohistochemistry (scale bar, 100 μm). b Measurement of cell viability in HNSCC PDOs treated with increasing concentrations of YKL-5-124 and samuraciclib. Each condition was performed in quadruplicates. Data shown as mean ± SD. c Measurement of cell viability in HNSCC PDOs treated with increasing concentrations of palbociclib. Each condition was performed in triplicates. Data shown as mean ± SD. d Table summarizing IC50 values for each PDO treated with CDK7 inhibitors and palbociclib. e Representative images of formed HNSCC PDOs treated with the indicated doses of YKL-5-124, samuraciclib or palbociclib for five days (scale bar, 200 μm)

References

    1. Sung, H. et al. Global cancer statistics 2020: GLOBOCAN estimates of incidence and mortality worldwide for 36 cancers in 185 countries. CA Cancer J. Clin.71, 209–249 (2021). - PubMed
    1. Argiris, A. et al. Evidence-based treatment options in recurrent and/or metastatic squamous cell carcinoma of the head and neck. Front Oncol.7, 72 (2017). - PMC - PubMed
    1. Ferris, R. L. et al. Nivolumab for recurrent squamous-cell carcinoma of the head and neck. N. Engl. J. Med.375, 1856–1867 (2016). - PMC - PubMed
    1. Burtness, B. et al. Pembrolizumab alone or with chemotherapy versus cetuximab with chemotherapy for recurrent or metastatic squamous cell carcinoma of the head and neck (KEYNOTE-048): a randomised, open-label, phase 3 study. Lancet394, 1915–1928 (2019). - PubMed
    1. Bonner, J. A. et al. Radiotherapy plus cetuximab for squamous-cell carcinoma of the head and neck. N. Engl. J. Med.354, 567–578 (2006). - PubMed

MeSH terms

Substances