. 2025 Nov;8(11):e70376.
doi: 10.1002/cnr2.70376.

DHCR7 as a Prognostic and Immunological Biomarker in Human Pan-Cancer: A Comprehensive Evaluation

Affiliations

DHCR7 as a Prognostic and Immunological Biomarker in Human Pan-Cancer: A Comprehensive Evaluation

Xianghua Wu et al. Cancer Rep (Hoboken). 2025 Nov.

Abstract

Background: The 7-Dehydrocholesterol reductase (DHCR7), a critical enzyme catalyzing the final step of the cholesterol biosynthesis pathway, has gained attention for its potential role in tumorigenesis. This study systematically investigated the association between DHCR7 expression and oncogenic processes across multiple cancer types.

Methods: Multi-omics data were obtained from The Cancer Genome Atlas (TCGA) and Gene Expression Omnibus (GEO) repositories. DHCR7 expression patterns were analyzed using Oncomine, TIMER, and GEPIA platforms. Prognostic significance was assessed via Kaplan-Meier plotter and GEPIA. Tumor stage correlations and immune/molecular subtype associations were evaluated using TISIDB. SangerBox facilitated analysis of DHCR7's associations with immune checkpoint (ICP) molecules, tumor mutational burden (TMB), microsatellite instability (MSI), mutant-allele tumor heterogeneity (MATH), neoantigen load, and immune cell infiltration.

Results: DHCR7 exhibited significant overexpression in most malignancies, correlating with advanced tumor stage (p < 0.05), metastatic progression, and reduced overall survival (HR = 1.34, 95% CI: 1.18-1.52). Strong associations emerged between DHCR7 expression and critical immunomodulatory parameters: positive correlations with ICPs (PD-L1: r = 0.62, CTLA4: r = 0.58). Significant links to TMB (p = 2.1e-5), MSI (p = 4.3e-4), and MATH (p = 7.8e-3). Distinct immune infiltration patterns, particularly in bladder carcinoma (BLCA), renal clear cell carcinoma (KIRC), and prostate adenocarcinoma (PRAD). Co-expression network analysis revealed DHCR7's involvement in immune response regulation (GO:0002764, FDR = 0.003), leukocyte differentiation (GO:0002521, FDR = 0.012), and angiogenesis (GO:0001525, FDR = 0.018).

Conclusions: These pan-cancer analyses identify DHCR7 as a multifaceted biomarker with dual prognostic and immunotherapeutic relevance. Its involvement in tumor immune microenvironment modulation suggests potential as a therapeutic target.

Keywords: DHCR7; Pan‐cancer analysis; immunotherapy; prognostic biomarker; tumor microenvironment.


Conflict of interest statement

The authors declare no conflicts of interest.

Figures

FIGURE 1
FIGURE 1
DHCR7 expression levels in human cancers. (A) DHCR7 expression in different cancers and paired normal tissue in the Oncomine database. (B) DHCR7 expression levels in different cancer types from the TCGA database analyzed by the TIMER database. (C) DHCR7 expression in several cancers and paired normal tissue in the GEPIA database (*p < 0.05, **p < 0.01, ***p < 0.001).
FIGURE 2
FIGURE 2
Highly DHCR7 expression is associated with poor overall survival in human cancers. Kaplan–Meier survival curve of human cancers with high and low DHCR7 expression analyzed by the Kaplan–Meier plotter database (A–H) and the GEPAI database (I–L). (A–H) Highly DHCR7 expression was related to worse OS in BLCA (n = 404), CESC(n = 304), HNSC(n = 499), LIHC(n = 370), LUAD(n = 504), PAAD(n = 177), SARC(n = 259), and UCEC(n = 542) cohorts. (I–J) High DHCR7 expression was related to worse OS and DFS in ACC (n = 76) cohorts. (K) High DHCR7 expression was related to worse OS in UVM (n = 78) cohorts. (L) High DHCR7 expression was related to worse DFS in LUSC cohorts (n = 482). (M–P) ROC curve analysis of DHCR7 expression in BLCA, CESC, HNSC, and LIHC. DFS, disease‐free survival; OS, overall survival; ROC, receiver operating characteristic curve.
FIGURE 3
FIGURE 3
The relationship between DHCR7 expression and pan‐cancer stages by TISIDB. (A) in BLCA, (B) in KICH, (C) in KIRP, (D) in LUAD, (E) in LUSC, (F) in TGCT.
FIGURE 4
FIGURE 4
The relationship between DHCR7 expression and pan‐cancer metastasis. (A) in Breast, (B) in Colon, (C) in Kidney, (D) in Liver, (E) in Lung, (F) in Oesophageal, (G) in Oral cavity, (H) in Pancreas.
FIGURE 5
FIGURE 5
The relationship between DHCR7 expression and pan‐cancer immune subtypes. (A) in ACC, (B) in BLCA, (C) in BRCA, (D) in COAD, (E) in HNSC, (F) in KIRC, (G) in KIRP, (H) in LUAD, (I) in LUSC, (J) in OV, (K) in PRAD, (L) in UCEC.
FIGURE 6
FIGURE 6
The relationship between DHCR7 expression and pan‐cancer molecular subtypes. (A) in ACC, (B) in BRCA, (C) in ESCA, (D) in HNSC, (E) in KIRP, (F) in LGG, (G) in LIHC, (H) in LUSC, (I) in PCPG, (J) in PRAD, (K) in STAD, (L) in UCEC.
FIGURE 7
FIGURE 7
The relationship between DHCR7 expression and pan‐cancer immune checkpoint genes. *p < 0.05; **p < 0.01; ***p < 0.001.
FIGURE 8
FIGURE 8
The relationship between DHCR7 expression and MSI (A), Neoantigen (B), TMB (C) and MATH (D) in human cancers. MATH, mutant‐allele tumor heterogeneity; MSI, microsatellite instability; TMB, tumor mutational burden.
FIGURE 9
FIGURE 9
The relationship between DHCR7 expression and infiltrating immune cells of human cancers and urogenital cancers. (A) The relationship between DHCR7 expression level and infiltrating levels of B cells, CD4+ T cells, CD8+ T cells, macrophages, neutrophils, dendritic cells in human cancers. (B) The relationship between DHCR7 expression level and infiltrating levels of B cell lineages, CD8+ T cells, cytotoxic lymphocytes, endothelial cells, fibroblasts, monocytic cell lineages, myeloid dendritic cells, neutrophils, natural killer cells, T cells in six urogenital cancers. *p < 0.05; **p < 0.01; ***p < 0.001.
FIGURE 10
FIGURE 10
DHCR7 genomic alterations in six urogenital cancers analyzed by the cBioPortal database (A–C) (A) OncoPrint of DHCR7 gene alterations in cancer cohort. (Different colors mean different types of genetic alterations and amplification accounts for the largest proportion). (B) main type of DHCR7 gene alterations in cancer groups. (C) Details of DHCR7 gene alteration types in cancer cohorts.
FIGURE 11
FIGURE 11
The staining of IHC and HE for DHCR7 in BLCA (A‐B) and DHCR7 differential expression in bladder cancer with different clinical subgroups (C–H) analyzed by the UALCAN database. (A) IHC staining for DHCR7 in normal tissue and BLCA patient tissue analyzed by HPA database; (B) HE staining for DHCR7 in BLCA patient tissue analyzed by HPA database; (C–H) DHCR7 expression between normal(n = 19) and BLCA primary tumor(n = 408) (C); DHCR7 differential expression in BLCA with individual cancer stages (n = 400) (D), histological subtypes (n = 403) (E), molecular subtypes (n = 408) (F), nodal metastasis status (n = 366) (G), TP53 mutation status (n = 408) (H) (*p < 0.05, **p < 0.01, ***p < 0.001).
FIGURE 12
FIGURE 12
DHCR7 co‐expression genes in BLCA analyzed through the Linked Omics database. (A) Highly correlated genes of DHCR7 tested by the Pearson test in the BLCA cohort. (B, C) Top 50 positive co‐expression genes (B) and negative co‐expression genes (C) of DHCR7 in the heat map in the BLCA; (D) Directed acyclic graph of DHCR7 GO analysis (biological process) in the BLCA cohort. (E) Volcano plot of DHCR7 KEGG pathways in the BLCA cohort.
FIGURE 13
FIGURE 13
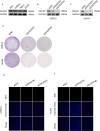
DHCR7 is required for growth and proliferation of renal cell carcinoma cells. (A) Western blotting analysis of DHCR7 levels in NK2, OSRC‐2, 786‐O, and ACHN cells, (B and C) after DHCR7 knockdown in OSRC‐2 and ACHN cell lines. (D–F) Colony formation assay and EdU stain were performed to detect the cell growth and proliferation in OSRC‐2 and ACHN cell lines.

References

    1. Kim J. H., Lee J. N., and Paik Y. K., “Cholesterol Biosynthesis From Lanosterol. A Concerted Role for Sp1 and NF‐Y‐Binding Sites for Sterol‐Mediated Regulation of Rat 7‐Dehydrocholesterol Reductase Gene Expression,” Journal of Biological Chemistry 276, no. 21 (2001): 18153–18160. - PubMed
    1. Waye J. S., Nakamura L. M., Eng B., et al., “Smith‐Lemli‐Opitz Syndrome: Carrier Frequency and Spectrum of DHCR7 Mutations in Canada,” Journal of Medical Genetics 39, no. 6 (2002): E31. - PMC - PubMed
    1. Kritzer A., Dutta R., Pramparo T., Terner‐Rosenthal J., Vig P., and Steiner R. D., “Smith‐Lemli‐Opitz Syndrome: Clinical, Biochemical, and Genetic Insights With Emerging Treatment Opportunities,” Genetics in Medicine 27 (2025): 101450. - PubMed
    1. Zou J., Liu S., Long J., and Yan B., “High DHCR7 Expression Predicts Poor Prognosis for Cervical Cancer,” Computational and Mathematical Methods in Medicine 2022 (2022): 8383885. - PMC - PubMed
    1. Chen Y., Yan W., Yang K., et al., “Integrated Multi‐Dimensional Analysis Highlights DHCR7 Mutations Involving in Cholesterol Biosynthesis and Contributing Therapy of Gastric Cancer,” Journal of Experimental & Clinical Cancer Research 42, no. 1 (2023): 36. - PMC - PubMed

MeSH terms

Substances

LinkOut - more resources