. 2025 Nov 6;25(1):1514.
doi: 10.1186/s12879-025-11691-y.

COMET-LF: a compartmental model of dynamics of infection, disease, and elimination strategies for lymphatic filariasis

Affiliations

COMET-LF: a compartmental model of dynamics of infection, disease, and elimination strategies for lymphatic filariasis

Indrajit Ghosh et al. BMC Infect Dis. .

Abstract

Background: Lymphatic filariasis (LF) is a mosquito-borne disease caused by filarial worms. The WHO has targeted LF elimination by 2030. Mathematical models can help evaluate and guide elimination strategies.

Methods: We developed a new compartmental model—COmpartmental Modelling of Elimination strategies and Transmission of Lymphatic Filariasis (COMET-LF)—to assess the impact of mass drug administration (MDA) on LF elimination. Our model incorporates efficacy data from clinical trials and generates estimates of disease (lymphoedema and hydrocele) prevalence. The model is calibrated to publicly available microfilaria (Mf) and disease prevalence data (2008-2013), and validated using programmatic data (2018-2019) from ten endemic districts of Bihar, India.

Results: COMET-LF simulation projected that at 85% coverage with a two- or three-drug regimen, six rounds of MDA should be sufficient to achieve elimination for baseline Mf prevalence up to 10%, consistent with the existing models - EPIFIL and LYMFASIM. The impact of MDA on disease burden, generated using COMET-LF, suggest that the disease prevalence reduces over much longer timescales - 20 years for a reduction of 8%-11.5% following 5 rounds of MDA. To investigate the role of migration, we implemented COMET-LF within a meta-population model. We found that high Mf prevalence in the spatial neighbourhood can require up to 3 additional rounds for the two-drug regimen. Migration between non-endemic and adjacent endemic regions (>5% Mf) may lead to a significant risk of resurgence.

Conclusion: Our COMET-LF model can capture LF transmission dynamics and estimate the number of MDA rounds required to reach elimination. MDA coverage, baseline Mf prevalences and human migration are the determinants of the required rounds of MDA. Our model can be easily tailored to specific blocks and districts to guide programmatic intervention for LF elimination and disease management.

Supplementary Information: The online version contains supplementary material available at 10.1186/s12879-025-11691-y.

Keywords: Disease prevalence estimation; Lymphatic filariasis; Mass drug administration; Mathematical modelling; Migration.


Conflict of interest statement

Declarations. Ethics approval and consent to participate: Not applicable. Consent for publication: Not applicable. Competing interests: The authors declare no competing interests.

Figures

Fig. 1
Fig. 1
a Flow diagram of COMET-LF. Susceptible humans (formula image) become infected with L3 larvae (formula image) through bites of infectious mosquitoes (formula image). They can either self-clear L3 (formula image), or become hosts to adult worms (formula image). Adult worms can mate to produce microfilaria (formula image). Susceptible mosquitoes (formula image), which take a blood meal from these humans, become exposed (formula image) and eventually become infectious. Humans with a history of adult worms or Mf can develop symptomatic disease (lymphoedema or hydrocele), represented in compartment formula image. MDA effects are modeled through additional cure rates formula image and formula image of the formula image and formula image compartments and by incorporating an additional compartment for people with sterilized adult worms (formula image). In the absence of MDA, these two rates as well as the formula image compartment are set to zero. b Schematic representation of the two-patch system. Humans in all compartments, except the disease compartment, migrate between the two patches with rate m
Fig. 2
Fig. 2
Methodology for projecting the required number of MDA rounds to reach < 1% Mf rate. The baseline Mf rate is considered to be 5% (4.5% - 5.5%). a Simultaneous fitting of Mf rate and disease rate. b Model generated trajectories of Mf rates achieving equilibrium Mf rates between 4.5% - 5.5%. c Model generated trajectories of disease rate corresponding to equilibrium Mf rate in previous step. d Starting from the equilibrium achieved in previous step, drug regimen DA with 45% MDA coverage is considered to generate future trends of Mf rates. Seven DA-MDA rounds are required to attain the elimination threshold of 1% Mf rate. The dotted red line indicates 1% Mf rate
Fig. 3
Fig. 3
COMET-LF model validation on observed data from 10 districts in Bihar. The height of the bars indicates mean Mf rates corresponding to observed and model-predicted mean values. The error bars represent one standard deviation from the means of Mf rates
Fig. 4
Fig. 4
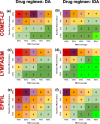
Predicted number of MDA rounds required to achieve 99% probability of elimination with DA (left panel) and IDA regimens (right panel) by COMET-LF (a)-(b), LYMFASIM (c)-(d) and EPIFIL (e)-(f). For each panel, the horizontal axis represents MDA coverages ranging from 45% to 85% and the vertical axis corresponds to baseline Mf rates 1.5%, 2%, 5% and 10%. Values in each cell represent the required number of MDA rounds for the corresponding scenario with respect to the indicated model
Fig. 5
Fig. 5
Projection of disease prevalence corresponding to two different initial baseline Mf rates of 10% (left column) and 2% (right column). MDA was applied for 5 years according to the following protocols, DA with formula image coverage (a-b) and IDA with formula image coverage (c-d). In each violin plot, the red circle in the middle represents the median value of the distribution whereas the grey bars spans from first to third quartile (interquartile range). The dashed grey lines indicate the trend of the median values
Fig. 6
Fig. 6
a Additional rounds of DA-MDA required in an index location adjacent to a neighbouring endemic region at a coverage of formula image. b Additional rounds of IDA-MDA required in an index location adjacent to a neighbouring endemic region at a coverage of formula image. c Risk of Mf transmission to a non-endemic patch after 5 years given the endemic patch has reached a baseline Mf rate for 3 migration rates formula image, formula image, and formula image

References

    1. Cromwell EA, Schmidt CA, Kwong KT, Pigott DM, Mupfasoni D, Biswas G, et al. The global distribution of lymphatic filariasis, 2000–18: a geospatial analysis. Lancet Glob Health. 2020;8(9):e1186–94. - PMC - PubMed
    1. Global programme to eliminate lymphatic filariasis: progress report. 2022. https://www.who.int/publications/i/item/who-wer9841-489-502. Accessed 02 Jan 2024.
    1. Lymphatic filariasis factsheet (World Health Organization). https://www.who.int/news-room/fact-sheets/detail/lymphatic-filariasis. Accessed 02 Jan 2024.
    1. Organisation mondiale de la Santé, World Health Organization, et al. Global programme to eliminate lymphatic filariasis: progress report, 2021–Programme mondial pour l’élimination de la filariose lymphatique: rapport de situation, 2021. Wkly Epidemiol Rec = Relevé Épidémiologique Hebdomadaire. 2022;97(41):513–24.
    1. National Vector Borne Disease Control Programme, National Health Mission. VL/LF update. Newsletter for visceral leishmaniasis (VL) and lymphatic filariasis (LF). Issue No. 4. NVBDCP; 2023. https://ncvbdc.mohfw.gov.in/Doc/VL-LF-Newsletter-December-2023.pdf. Accessed 25 Jun 2024.

LinkOut - more resources