. 2025 Nov 7;11(45):eadx4338.
doi: 10.1126/sciadv.adx4338. Epub 2025 Nov 7.

Endogenic heat at Enceladus' north pole

Affiliations

Endogenic heat at Enceladus' north pole

Georgina Miles et al. Sci Adv. .

Abstract

The long-term survival of Enceladus' ocean depends on the balance between heat production and heat loss. To date, the only place where a direct measurement of Enceladus's heat loss has been made is at the south pole. Here, we show that the north pole also emits heat at a greater rate than can be explained by purely passive models. By comparing winter and summer observations taken with the Cassini Composite InfraRed Spectrometer, we find a winter temperature ~7 kelvin warmer than passive modeling predicts, accounting for uncertainties in emissivity and thermal inertia. An additional endogenic heat flux of 46 ± 4 milliwatts per square meter is required to match the observed radiance. The implied local shell thickness is 20 to 23 kilometers-consistent with the higher end of thickness models based on gravity, topography, and libration measurements. This work provides a previously unidentified constraint for models of tidal heat production, shell thickness, and the long-term evolution of Enceladus' ocean.


Conflict of interest statement

The authors declare that they have no competing interests.

Figures
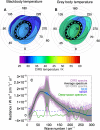
Fig. 1.
Fig. 1.. CIRS FP1 observations of Enceladus’ north pole.
CIRS FP1 FOV in the northern polar region observed on 14 July 2005 during northern hemisphere winter. The pole is in winter darkness. Temperatures correspond to (A) a single temperature blackbody fit and (B) (improved) gray body temperature joint fit with emissivity to the individual spectra, with the location of the average stare FOV shown by the dashed line. The Saturn-facing hemisphere is centered at 0°W at the bottom of the panels. (C) Spectra of 110 stare observations corresponding to those shown in (A) and (B) over the north pole of Enceladus. Also shown are the averaged spectrum, the standard deviation of the stare spectra, and the standard error on the mean (SEM). In addition, the noise equivalent spectral radiance (NESR) appropriate for the original resolution of the interferogram (5 cm−1) is shown (blue dashed line). The nearest deep-space spectrum is shown in green to convey the minimum systematic and random noise of the instrument. The features around 90 and 190 cm−1 are well-documented artifacts of the CIRS FP1 spectra (26).
Fig. 2.
Fig. 2.. CIRS observation and temperature fit.
(A) CIRS north pole radiance spectra from 14 July 2005 (gray), averaged spectrum (black), single temperature (1T) Planck function temperature fit (blue), and gray body temperature and effective emissivity (T+ ε′) fit (orange). (B) Averaged CIRS spectrum in BT.
Fig. 3.
Fig. 3.. Emissivity and temperature relationship.
(A) CIRS FP1 quasistares derived from all available observations with criteria area <105 km2, FOV center latitude north of 50°S, and minimum number of contributing spectra of 10. The population is independent of the north polar stare observation. (B) Subset of (A) where the maximum area considered is 104 km2 (except at high northern latitudes), where ε′ from the joint fit is plotted against blackbody temperature. The green line is a fit to the data, the equation for which is given in Eq. 1 (Materials and Methods).
Fig. 4.
Fig. 4.. Projected detector response and modeled surface gray body temperature at the time of observation.
The average CIRS FP1 FOV ellipse is shown in black. The model uses a bolometric albedo of 0.76, a thermal inertia of 16 MKS, and empirically derived ε′ for the model temperature (see Materials and Methods). The FOV is in winter polar darkness. The thermal gradient across the pole arises from infrared Saturn shine on the Saturn-facing hemisphere. (A) Projected FP1 detector response. (B) Passive model. (C) With an additional 46 mW m−2 endogenic heat input at the base slab of the model. (B) and (C) may be compared with Fig 1B.
Fig. 5.
Fig. 5.. Modeled spectrum.
(A) Observed, fit, and modeled CIRS spectra with modeled passive (green) and passive and endogenic (red) filled ranges of uncertainty arising from the error associated with the fitted CIRS effective emissivity. Dashed lines represent model uncertainty from the ranges of thermal inertia (3 to 33 MKS) and albedo (0.7 to 0.82). 1T and T+ ε′ fits are as defined for Fig. 2. (B) The same radiances are converted to BT.
Fig. 6.
Fig. 6.. Observed and modeled summer (upper box/red) and winter (bottom box/blue) north polar temperatures.
(A) Passive model of temperatures predicted by the range of thermal inertia and bolometric albedo derived in (11): 1613+17 MKS and 0.76 ± 0.06, respectively (red and blue), compared to the CIRS data (black). This model fails to match the winter stare observation (average location in blue). BB, blackbody. (B) High surface thermal inertia (75 MKS) case required to match the observed winter polar radiance. This model fails to match the summer/lower-latitude observations. (C) High subsurface thermal inertia (15 MKS at the surface and 250 MKS from 15-cm deep) profile that achieves a close match to summer observations but fails to match the winter stare. For (C) and (D), error bars in red result from bolometric albedo uncertainty as thermal inertia is fixed. (D) As (A) but with 46 mW m−2 endogenic heat added to the base of the model, which fits all the observations. (E) CIRS FP1 FOV in northern hemisphere summer (red) and the winter stare observation (blue).
Fig. 7.
Fig. 7.. Ice shell thickness and conductive heat flux.
Ice shell thickness and conductive heat flux are shown for the north polar region (A and C) and for the global mean (B and D). We consider both zero porosity ice [solid curves in (A) and (B)] and ice with a porous layer [dash-dotted curves in (C) and (D)] and, therefore, lower thermal conductivity (Materials and Methods). The curves assume surface temperatures of Ts = 51 K (A and C) or Ts = 60 K (B and D). Basal temperatures are Tb = 270 K in all cases. Solid rectangles in (B) and (D) show global mean shell thicknesses estimated from various published studies and the corresponding global mean surface heat flux. These shell thicknesses are extrapolated to the north polar region (Materials and Methods) and shown in (A) and (C) as dotted rectangles. Our estimated north polar heat flux is shown by the dashed horizontal line and shaded band in (A) and (C) with the solid black rectangle showing how this relates to the north polar shell thickness. This is extrapolated to the global mean thickness and shown as dotted rectangles in (B) and (D) using two different shape models (see Materials and Methods). Shell thickness uncertainties for the model are artificial (see Materials and Methods).

References

    1. F. Nimmo, A. C. Barr, M. Běhounková, W. B. McKinnon, “Geophysics and tidal-thermal evolution of Enceladus” in Enceladus and the Icy Moons of Saturn (The University of Arizona Press, 2018).
    1. Cockell C. S., Simons M., Castillo-Rogez J., Higgins P. M., Kaltenegger L., Keane J. T., Leonard E. J., Mitchell K. L., Park R. S., Perl S. M., Vance S. D., Sustained and comparative habitability beyond Earth. Nat. Astron. 8, 30–38 (2023).
    1. Fuller J., Luan J., Quataert E., Resonance locking as the source of rapid tidal migration in the Jupiter and Saturn moon systems. Mon. Not. R. Astron. Soc. 458, 3867–3879 (2016).
    1. Lainey V., Casajus L. G., Fuller J., Zannoni M., Tortora P., Cooper N., Murray C., Modenini D., Park R. S., Robert V., Zhang Q., Resonance locking in giant planets indicated by the rapid orbital expansion of Titan. Nat. Astron. 4, 1053–1058 (2020).
    1. Rhoden A. R., Ferguson S. N., Bottke W., Castillo-Rogez J. C., Martin E., Bland M., Kirchoff M., Zannoni M., Rambaux N., Salmon J., Geologic constraints on the formation and evolution of Saturn’s mid-sized moons. Space Sci. Rev. 220, 55 (2024). - PMC - PubMed

LinkOut - more resources