. 2025 Nov 8:122:106021.
doi: 10.1016/j.ebiom.2025.106021. Online ahead of print.

Age- and sex-specific lipoprotein profiles in general and cardiometabolic population cohorts

Affiliations

Age- and sex-specific lipoprotein profiles in general and cardiometabolic population cohorts

Ricardo Conde et al. EBioMedicine. .

Abstract

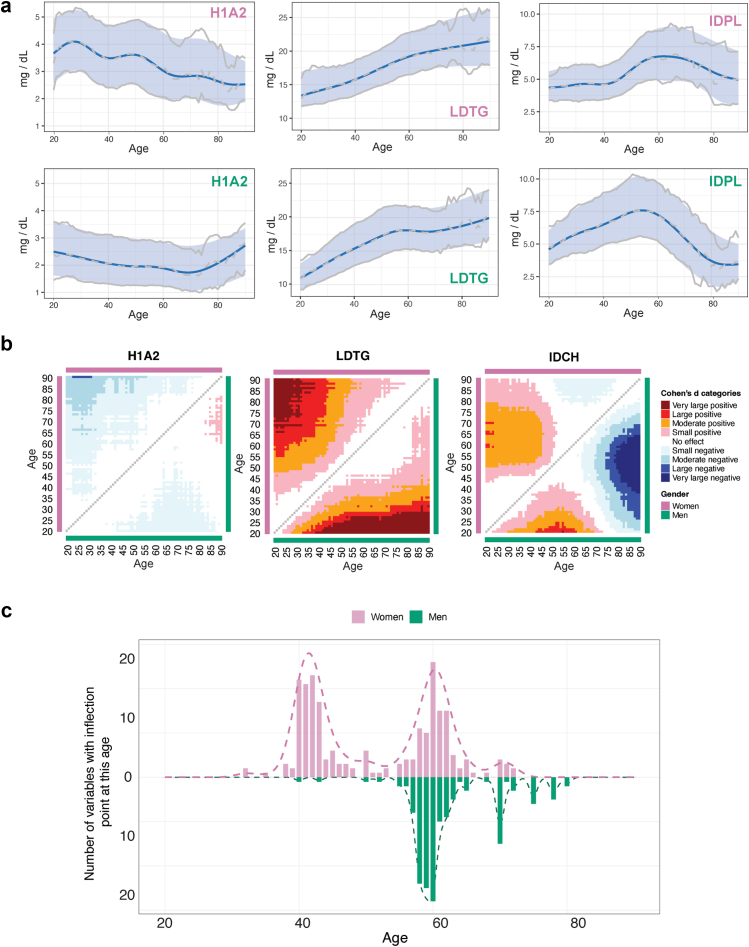
Background: Nuclear magnetic resonance (NMR) spectroscopy enables the characterisation of lipoprotein sub-particles, providing a more detailed lipid profile than the conventional lipid measurements, with potential clinical relevance, particularly in cardiovascular disease (CVD), which remains the leading cause of mortality worldwide. Nonetheless, for clinical implementation, it is essential to first determine the normal variation of lipoprotein parameters by age and sex.

Methods: This cross-sectional study analysed a large dataset of 31,275 serum or plasma samples from five different countries using the B.I.LISA™ NMR-based platform, quantifying 112 lipoprotein parameters, including subclass size and concentration. Lipoprotein parameters from specific cohorts were fitted to a Quantile Generalised Additive Model (QGAM) to calculate the different percentiles as a function of age and sex.

Findings: A sub-cohort of individuals belonging to non-oriented cohorts (27,470 individuals) showed that lipoprotein parameters exhibit distinct sex- and age-dependent patterns, with inflection points observed around 44 and 60 years in women and around 60 years in men, aligning with known ageing acceleration models. The sub-cohort of 3021 individuals showing cardiometabolic risk factors was used to evaluate the effect of obesity, hypertension and diabetes in the lipoprotein distribution. Finally, we analysed the lipoprotein parameters that align with SCORE2 (a well-known CVD risk predictor) in an age- and sex-dependent manner. Many NMR-derived parameters effectively distinguish between low and high/very high CVD risk profiles, with very low-density (VLDL)-associated parameters demonstrating the highest sensitivity across a broad age range.

Interpretation: Our findings provide reference values for NMR-derived lipoprotein parameters by age and sex, enabling their accurate interpretation in the context of cardiovascular disease risk stratification.

Funding: The specific funding of this article is provided in the acknowledgements section.

Keywords: Ageing; Cardiovascular disease risk; Lipids; Lipoproteins; NMR spectroscopy; SCORE2.


Conflict of interest statement

Declaration of interests JMM and OM as well as other authors have an agreement with Bruker to provide free B.I. methods access for IVDr based quantification of serum metabolites and lipoproteins (B.I. QUANT-PS™ and B.I. LISA™).

Figures

Fig. 1
Fig. 1
(A) Distribution of sample donors as a function of age, origin and sex. Cohorts: BCP, Basque Country population Cohort (n = 21,733); SPBB, Spanish Biobanks cohort (n = 2491); DDM, DDM-Madrid cohort (n = 913); LV, Liver Bible cohort (n = 1035); BPM, BioPersMed cohort (n = 279); BHAS, Busselton Healthy Ageing Study (n = 3792); BPH, benign prostate hyperplasia cohort; BIOAg, Biosilver cohort (n = 225); LA2, LA2 cohort (n = 248); EBIC, EBI cohort (n = 244). Cohorts with the name in black/blue correspond to the NOC/CVR categories. (B) Comparison of the main lipoprotein parameters as determined by NMR spectroscopy (abscise axis) or by standard clinical analysis (ordinate axis) for all the samples under consideration (n = 31,275).
Fig. 2
Fig. 2
(A) Selected examples of lipoprotein distribution for the NOC cohorts as a function of age and sex, as indicated. Grey lines represent the raw experimental values for the median (dashed line) or the Q25 and Q75 quantiles (solid lines). The equivalent values obtained with the QGAM model are shown with the blue solid line (median) and the blue shaded area (Q25-Q75 interquartile range). (B) Cohen's d values for the same selected examples, with positive values (warm colours) indicating increased lipoprotein levels with age and negative values (cold colours) indicating decreased levels. The upper/lower triangle of the plot represents women/men, as indicated by the colour code (purple/green). (C) Histogram on the number of inflexion points observed in the age evolution plots of the lipoprotein parameters as a function of age and obtained from the analysis of the 112 lipoprotein parameters. The accumulation of inflexion points at a given age is a readout for non-linear age ranges. When necessary, plots use the colours purple/green to refer to women/men.
Fig. 3
Fig. 3
(A) Heatmap to compare the sex variations of lipoprotein parameters. Blue/red colours indicate higher/lower concentration in women. The black horizontal lines separate the different sub-fractions (including CH, PL, TG, FC and the corresponding apolipoproteins). (B) Age and sex evolution of the main NMR-based lipoprotein parameters. The relative distribution of the lipoprotein composition (including CH, FC, PL and TG) is indicated by the colour code, as shown in the legend and quantified in the left ordinate axis. The total number of the particle (right ordinate axis) is shown with solid red lines when available.
Fig. 4
Fig. 4
Deviation of lipoprotein quantile positions from the population median in individuals with diabetes, obesity, and hypertension. Each dot represents the average absolute deviation from the median quantile (0.5) for a given lipoprotein, in individuals with the specified risk factor. Lipoprotein levels were previously normalised using sex- and age-specific QGAM-derived quantile models. This transformation enables the comparison of lipoprotein distributions across individuals independently of age and sex. Higher deviations indicate stronger divergence from the expected distribution, suggesting a specific influence of the risk factor on that lipoprotein subclass. Lipoproteins are grouped and colour-coded by density class: HDL (green), LDL (yellow), IDL (grey), and VLDL (magenta).

References

    1. Vasatova M., Pudil R., Horacek J.M., Buchler T. Current applications of cardiac troponin T for the diagnosis of myocardial damage. Adv Clin Chem. 2013;61:33–65. - PubMed
    1. Garg N., Muduli S.K., Kapoor A., et al. Comparison of different cardiovascular risk score calculators for cardiovascular risk prediction and guideline recommended statin uses. Indian Heart J. 2017;69(4):458–463. - PMC - PubMed
    1. Goel P.K., Ashfaq F., Khanna R., Ramesh V., Pandey C.M. The association between small dense low density lipoprotein and coronary artery disease in north Indian patients. Indian J Clin Biochem. 2017;32(2):186–192. - PMC - PubMed
    1. Tian F., Chen L., Qian Z., et al. Ranking age-specific modifiable risk factors for cardiovascular disease and mortality: evidence from a population-based longitudinal study. EClinicalMedicine. 2023;64 - PMC - PubMed
    1. Otvos J.D., Mora S., Shalaurova I., Greenland P., MacKey R.H., Goff D.C. Clinical implications of discordance between low-density lipoprotein cholesterol and particle number. J Clin Lipidol. 2011;5(2):105–113. - PMC - PubMed

LinkOut - more resources