Evaluation of the stability of deep vein thrombosis based on computed tomography energy spectrum
- PMID: 41209192
- PMCID: PMC12591745
- DOI: 10.21037/qims-2025-20
Evaluation of the stability of deep vein thrombosis based on computed tomography energy spectrum
Abstract
Background: The stability of deep vein thrombosis (DVT) is currently a hotspot and difficult point of research for scholars in various countries. This study aimed to explore the feasibility of predicting the stability of DVT based on energy spectrum computed tomography (CT). The primary objective is to determine whether energy spectrum CT parameters can predict DVT stability. The secondary objective is to evaluate the predictive value of individual/combined parameters of spectral CT for acute pulmonary embolism (APE) risk.
Methods: Patients who underwent lower limb energy spectrum CT and were diagnosed with DVT and underwent computed tomography pulmonary angiography (CTPA) at the First Affiliated Hospital of Hebei North University from October 2023 to November 2024 were consecutively enrolled in this study. Overall, 63 patients with DVT were included and categorized into DVT combined with APE group (n=40) and DVT without APE group (n=23). The quantitative energy spectrum CT parameters were compared between the two groups, including 40 keV CT value, the slope of the energy spectrum curve (λ), effective atomic number (Eff-Z), concentrations of calcium-water [Ca(W)], water-calcium [W(Ca)], iodine-water [I(W)], water-iodine [W(I)], calcium-iodine [Ca(I)], and iodine-calcium [I(Ca)].
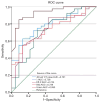
Results: The 40 keV CT value, λ, Eff-Z, and I(W) value were statistically different between the two groups (P<0.05). The 40 keV CT value, λ, Eff-Z, and I(W) value were independent predictors of combined APE in patients with DVT. The area under the curve of 40 keV CT value, λ, Eff-Z, and I(W) values for predicting the risk of APE in patients with DVT were 0.791 [95% confidence interval (CI): 0.681-0.901], 0.726 (95% CI: 0.592-0.860), 0.745 (95% CI: 0.620-0.869), and 0.739 (95% CI: 0.617-0.860), respectively, and the combined curve was 0.930 (95% CI: 0.868-0.992). The calibration curves showed that the combined curve of the energy spectrum CT parameters was better in predicting the risk of APE in patients with DVT. The decision curve showed that the combined curve of energy spectrum CT parameters had a high clinical application value.
Conclusions: The quantitative parameters of 40 keV CT value, λ, Eff-Z, and I(W) value derived on energy spectrum CT can be used as independent predictors of the risk of APE in patients with DVT, and the combined use of the energy spectrum parameters had valuable predictive performance for the risk of APE.
Keywords: Deep vein thrombosis (DVT); acute pulmonary embolism (APE); energy spectrum computed tomography (energy spectrum CT); stability.
Copyright © 2025 AME Publishing Company. All rights reserved.
Conflict of interest statement
Conflicts of Interest: All authors have completed the ICMJE uniform disclosure form (available at https://qims.amegroups.com/article/view/10.21037/qims-2025-20/coif). The authors have no conflicts of interest to declare.
Figures


References
-
- Konstantinides SV, Meyer G, Becattini C, et al. 2019 ESC Guidelines for the diagnosis and management of acute pulmonary embolism developed in collaboration with the European Respiratory Society (ERS): The Task Force for the diagnosis and management of acute pulmonary embolism of the European Society of Cardiology (ESC). Eur Respir J 2019;54:1901647. 10.1183/13993003.01647-2019 - DOI - PubMed
LinkOut - more resources
Full Text Sources
Research Materials
Miscellaneous
