Review
. 2025;221(8):105.
doi: 10.1007/s11214-025-01233-y. Epub 2025 Nov 5.

GLObal Solar Wind Structure (GLOWS)

Affiliations
Review

GLObal Solar Wind Structure (GLOWS)

Maciej Bzowski et al. Space Sci Rev. 2025.

Abstract

Information on the evolution of latitudinal profiles of the solar wind speed and density is one of the important elements needed to understand global observations of heliospheric neutral and charged particle populations performed by NASA's integrated heliospheric observatory Interstellar Mapping and Acceleration Probe (IMAP). This information is provided by the GLObal solar Wind Structure (GLOWS) experiment. GLOWS is a single-pixel Lyman- α photometer that observes the heliospheric backscatter glow emitted by interstellar neutral (ISN) H inside the heliosphere, illuminated by the solar Lyman- α emission. GLOWS features a specially designed optical entrance system with a baffle, collimator, and interference filter; a channeltron-based photon event detector; a digital processing unit (DPU) with custom-designed software that registers photon events and assembles lightcurves; a front-end electronics block that interfaces the detector and DPU; and the necessary power and voltage distribution system. Due to charge-exchange between ISN H and the solar wind, the helioglow bears imprints of the solar wind structure. Analysis of lightcurves observed daily along Sun-centered circles with a 75° radius in the sky yields profiles of intensities of the charge exchange reaction, which are decomposed into solar wind speed and density profiles at a Carrington period cadence. With them, it is possible to infer the shape of the heliosphere and its variation during the solar cycle and to determine the attenuation through re-ionization of energetic neutral atom fluxes between the ENA creation sites in the inner heliosheath and the IMAP ENA detectors.


Conflict of interest statement

Competing InterestsThe authors have no conflicts of interest to declare that are relevant to the content of this article.

Figures

Fig. 1
Fig. 1
Color-coded sky maps of the helioglow for an observer located at the upwind (left) or crosswind (right) vantage points at 1 au, simulated for two models of latitudinal distribution of the ionization rate of ISN H: spherically symmetric (upper row) and latitudinally structured (middle row). The darkening of the helioglow in an equatorial band, clearly visible in the second row of helioglow maps, is due to an increased ionization in an equatorial latitudinal band (Porowski et al. 2023). Dots mark stars visible in the GLOWS waveband. The lower-left panel presents the observation geometry viewed from above the ecliptic plane, with IMAP (purple) sitting at L1 inside the Earth orbit, and GLOWS scanning a 75° circle in the sky (red) centered 4° off the Sun. The scanning circle is represented by red and green circles in the sky maps. The lower right panel presents the lightcurves for the scanning circles shown in the maps. The maps and the lightcurves are normalized to the mean values for the individual lightcurves. GLOWS seeks to interpret departures of the actually observed lightcurves, expected to be similar to those drawn with solid lines, from those characteristic for spherically symmetric ionization rates, presented in the lower panel with broken lines. Note the spikes in the lightcurves due to EUV-bright stars traversing the instrument FoV during scanning
Fig. 2
Fig. 2
GLOWS flight model, with signatures of the GLOWS team and logos of the Polish Ministry for Science and Education and CBK PAN
Fig. 3
Fig. 3
Block diagram of the GLOWS Lyman-α photometer
Fig. 4
Fig. 4
Left: cross section of GLOWS. The blue-hashed volume marks the region of free access of photons to the detector. It corresponds to the effective FoV. The orange region, defined by the sunshield, marks the FoR, which must be kept free from any objects, in particular the Sun, Earth, and Moon. The collimator, optical filter, Ni mesh, and detector are located to the right from the blue-hashed region. Right: a slightly off-center photo of the entrance to the blackened flight-model baffle, with individual diaphragms visible
Fig. 5
Fig. 5
Arrangement of the collimator tubes (left), a slightly off-axis view of the assembled collimator unit (center), with the blackening applied, and details of mounting of the collimator with the optical filter and the grounded mesh mounted between the filter and the CEM opening (right). The red circle in the left panel marks the perimeter of the active surface of the CEM detector. The offset view of the collimator of the center panel illustrates the uneven light transmission between the collimator tubes at an off-axis geometry
Fig. 6
Fig. 6
Block diagram of the GLOWS FEE
Fig. 7
Fig. 7
Gain (multiplication factor) of the CEM used in the GLOWS FM as a function of the voltage applied (left panel) and the threshold level for charge detection vs the THRS voltage applied to pin 3 of Amptek A121 (right panel)
Fig. 8
Fig. 8
Design diagram of the GLOWS Digital Processing Unit (DPU)
Fig. 9
Fig. 9
Design diagram of the GLOWS DPU FPGA
Fig. 10
Fig. 10
Block diagram of the GLOWS power supply unit (PSU)
Fig. 11
Fig. 11
Block diagram of the GLOWS high-voltage power supply unit (left) and a photograph of its electronic board (right)
Fig. 12
Fig. 12
Left panel: a 31 × 31-points raster scan over the instrument aperture showing measurements of the number of counts per 100 incoming photons for the Lyman-α wavelength. Right panel: spectral response of the instrument
Fig. 13
Fig. 13
Results of the PSF measurements in PTB (left panel) and in CBK PAN (right panel) compared with dedicated numerical simulations and the final inferred PSF. The horizontal axis represents offsets of the beam direction from the center. The PSF is dimensionless, with normalization to 1 at the peak
Fig. 14
Fig. 14
Left panel: comparison of the HV gain characteristics from the PTB calibration with the last TVAC and PSF measurements at CBK PAN before shipment of the instrument. Right panel: dark counts of the instrument as a function of high voltage HV and temperature. The black dashed line represents the upper envelope for dark count rate for temperatures below 30 °C
Fig. 15
Fig. 15
Panel (a): sky map of the stars visible in the EUV band. The GLOWS scanning circle is drawn as the black circle. The red rectangle is centered at the position of the selected calibration star (in this case α Vir). Panel (b): The expected GLOWS lightcurve. The red vertical lines mark the bins affected by the calibration star signal (the same bins that are colored in panel (c)). Panel (c): zoom into the neighborhood of the selected calibration star. The colors of the bins on the scanning circle show the angular distance between the star and the center of the bin. Panel (d): Simulated count rate as a function of angular distance between the calibration star and the nearest bin on the scanning circle. The black line shows a linear fit to the simulated data
Fig. 16
Fig. 16
Schematic representation of the transition between subsequent observation days, with a timeline demonstrating the sequence and durations of GLOWS operation modes. Note that by default, HVTARGET = HVSAFE, and thus the sunset time is equal to 0
Fig. 17
Fig. 17
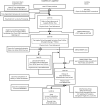
A scheme of the pipeline for processing of GLOWS data from Level 0 (telemetry packets) to Level 2 (daily-averaged calibrated lightcurve)
Fig. 18
Fig. 18
A scheme of the processing of GLOWS data products within data level L3

References

    1. Baliukin II, Bertaux J-L, Quémerais E, Izmodenov VV, Schmidt W (2019) SWAN/SOHO Lyman-formula image mapping: the hydrogen geocorona extends well beyond the moon. J Geophys Res 124:861–885. 10.1029/2018JA026136
    1. Baliukin I, Bertaux JL, Bzowski M, Izmodenov V, Lallement T, Provornikova E, Quémerais E (2022) Backscattered solar Lyman-formula image emission as a tool for the heliospheric boundary exploration. Space Sci Rev 218:45. 10.1007/s11214-022-00913-3. arXiv:2206.15175 [astro-ph.SR]
    1. Barciński T, Kosturek R, Kowalski T, Bzowski M, Wawrzaszek R, Mostowy K, et al. (2024) The effect of the coating process thermal cycle on mechanical properties of AA6061-T6 used for load-carrying elements of a space instrument: a case study. Bull Pol Acad Sci 72(5):e150338. 10.24425/bpasts.2024.150338
    1. Bertaux JL, Kyrölä E, Quémerais E, Pellinen R, Lallement R, Schmidt W, et al. (1995) SWAN: a study of solar wind anisotropies on SOHO with Lyman Alpha sky mapping. Sol Phys 162(1–2):403–439. 10.1007/BF00733435
    1. Bertaux JL, Lallement R, Quémerais E (1996) UV studies and the solar wind. Space Sci Rev 78:317–328. 10.1007/BF00170818

LinkOut - more resources