. 2025 Nov 10;16(1):9868.
doi: 10.1038/s41467-025-64833-w.

Alterations in peroxisome-mitochondria interplay in skeletal muscle accelerate muscle dysfunction

Affiliations

Alterations in peroxisome-mitochondria interplay in skeletal muscle accelerate muscle dysfunction

Marco Scalabrin et al. Nat Commun. .

Abstract

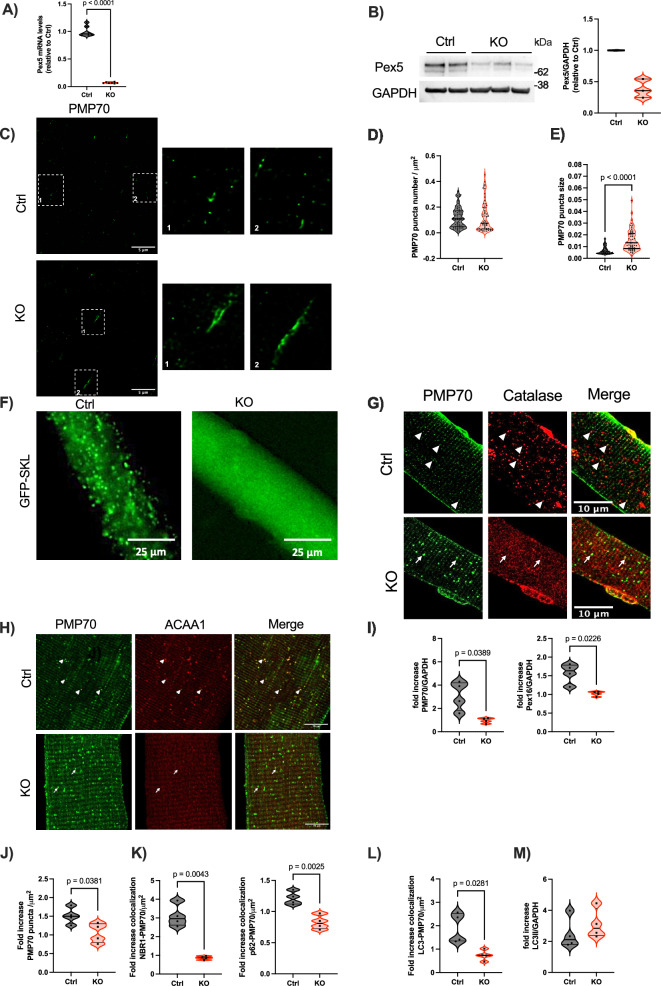
Skeletal muscles, which constitute 40-50% of body mass, regulate whole-body energy expenditure and glucose and lipid metabolism. Peroxisomes are dynamic organelles that play a crucial role in lipid metabolism and clearance of reactive oxygen species, however their role in skeletal muscle remains poorly understood. To clarify this issue, we generated a muscle-specific transgenic mouse line with peroxisome import deficiency through the deletion of peroxisomal biogenesis factor 5 (Pex5). Here, we show that Pex5 inhibition results in impaired lipid metabolism, reduced muscle force and exercise performance. Moreover, mitochondrial structure, content, and function are also altered, accelerating the onset of age-related structural defects, neuromuscular junction degeneration, and muscle atrophy. Consistent with these observations, we observe a decline in peroxisomal content in the muscles of control mice undergoing natural aging. Altogether, our findings show the importance of preserving peroxisomal function and their interplay with mitochondria to maintain muscle health during aging.


Conflict of interest statement

Competing interests: The authors declare no competing interests.

Figures

Fig. 1
Fig. 1. Impaired peroxisome assembly, protein import and pexophagy flux in Pex5 KO skeletal muscle.
Pex5 mRNA (A) and protein levels (B) in tibialis anterior (TA) muscles of KO mice. GAPDH, glyceraldehyde-3 phosphatedehydrogenase. Each dot represents a single muscle (A: n = 7 Ctrl/KO; B: Ctrl n = 2; KO n = 3). C Representative STED images of longitudinal TA fibers showing endogenous peroxisomes, immunostained with anti-PMP70, from 3mo control and KO mice. The square corresponds to the magnification shown on the right. Quantification of PMP70-positive puncta number normalized to fiber area (D), and size (E). Each dot represents a single TA fiber analyzed (Ctrl n = 70; KO n = 57). F Representative images of GFP-SKL transfection into FDB fibers. Left: GFP-positive puncta in control fibers; right: GFP cytosolic distribution in KO fibers. G Representative images of PMP70 and catalase immunostaining in isolated FDB fibers. Arrowheads indicate PMP70-positive structures containing catalase in control fibers; arrows show PMP70-positive structures in KO muscle without catalase signaling. H Representative images showing PMP70 and ACAA1 immunostaining in FDB fibers. Arrowheads indicate PMP70-positive structures containing ACAA1 in control fibers; arrows show PMP70-positive structures with reduced ACAA1 in KO fibers. I Fold increase, expressed as the ratio between colchicine-treated and untreated samples, of PMP70 and Pex16 protein levels normalized to GAPDH. J Fold increase of PMP70-positive puncta following colchicine treatment. K Fold increase of PMP70-positive puncta colocalizing with NBR1 or p62 after colchicine treatment. L Fold increase of PMP70-positive puncta colocalizing with LC3 following colchicine treatment. JL All data were normalized to muscle fiber area. M Fold increase of LC3 II protein levels normalized to GAPDH after colchicine treatment. IM Each dot represents a single TA muscle (n = 4 Ctrl/KO; values calculated as the ratio of colchicine-treated to untreated samples from the same genotype). All data were obtained from the analysis of 3-month-old mice muscles. Data shown as violin plots (with individual data points). Data were analyzed with unpaired two-sided Welch’s t tests (A, D, E, IM). Source data are provided as a source data file.
Fig. 2
Fig. 2. Alterations in Pex5-null muscle lipidomic profile.
A Volcano plot based on untargeted lipidomics analysis performed in 3mo gastrocnemius muscles comparing Ctrl vs. KO. Significantly increased lipids (p < 0.01) are shown in red and significantly decreased lipids in blue. Labels were added automatically for lipids exceeding the significance threshold (p < 0.01), based on spatial constraints to avoid overlap. B Skeletal muscle concentration of total phosphatidylcholine (PC[P]), and phosphatidyletanolamine (PE[P]) plasmalogen species is reduced in KO muscle. Each dot represents a single muscle (3mo: Ctrl n = 4; KO n = 7). C Phosphatidylcholine (PC), phosphatidylethanolamine (PE) and triglycerides (TG) with longer unsaturated acyl chains increase in 3mo KO muscle. Heatmaps show log₂ fold changes (logFC) for PC, PE, and TG species, plotted by total acyl chain length (sum of all fatty acyl chains, y-axis) and total unsaturation (x-axis). Color indicates logFC, red: increases, blue: decreases. The dashed line indicates C40 acyl chains. D Total cardiolipin (CL) muscle concentration in skeletal muscle at 3 and 18mo. Each dot represents a single muscle (3mo: Ctrl n = 4; KO n = 7; 18mo: n = 7 Ctrl/KO). E CL chain length over C72 and unsaturation increases in KO muscle at both ages. Dashed line indicates C72. All lipidomics data were normalized to dry tissue weight. 3mo and 18mo refer to samples from 3- and 18-month-old mice. Data shown as violin plots (with individual data points). Unpaired two-sided Welch t test was used in (A, B, and D). Source data are provided as a source data file.
Fig. 3
Fig. 3. Pex5 ablation in skeletal muscle results in progressive mitochondrial content decline.
A, B Transcriptomic RNA-seq Gene Ontology Enrichment Analysis (GOEA) showing downregulation of metabolic pathways-related genes. A Biological processes (BP) significantly inhibited at 9 months. Enrichment Score of each BP term is plotted. B BP significantly inhibited at 18mo. Enrichment Score of each BP term is plotted. C Heatmap of 25 mitochondria-related genes inhibited in KO vs CTRL at 9mo. Heatmap showing the expression of these transcripts at 3, 9 and 18mo. DEGs: Differentially Expressed Genes. Mitochondrial DNA copy number (D) and citrate synthase activity quantification (E) in TA muscle at 3,9, and 18mo. D Each dot represents a single muscle analyzed (3mo: Ctrl n = 4; KO n = 7; 9mo and 18mo: n = 7 Ctrl/KO). Data are normalized to controls. E Each dot represents a single muscle analyzed (3mo: n = 4 Ctrl/KO; 9mo: n = 6 Ctrl/KO; 18mo: n = 7 Ctrl/KO). Data are normalized to controls. F Mitochondrial number quantified from muscle fibers obtained from 4 muscles per genotype at 3, 9, and 18mo. Each dot in the graph represents the quantification from a single muscle fiber (n = 30 per group for all ages). G Mitophagy flux analyzed by electroporation of mt-mKEIMA into flexor digitorum brevis (FDB) muscles of 9mo Ctrl and KO mice. Changes in the fluorescent spectra were used to calculate the mitophagy/area index, normalized to the myofiber area. Each dot represents a single FDB fiber isolated from 4 mice for each genotype (9mo: Ctrl n = 41; KO n = 49). H Densitometric quantification of PGC1α/β by WB, normalized to GAPDH, in muscles at 9 and 18 months. Each dot represents a single muscle analyzed (9mo and 18mo: n = 7 Ctrl/KO). Unless otherwise stated, data are presented as violin plots (with individual data points). 3mo, 9mo and 18mo refer to samples from 3-, 9-, and 18-month-old mice. Unpaired two-sided Welch’s t tests (D, E (lower panel), F, and H) and Mann–Whitney test (upper and middle panels of E and G) were used for experiments comparing two groups. Source data are provided as a source data file.
Fig. 4
Fig. 4. Progressive mitochondrial ultrastructural and functional alterations in Pex5-null muscle.
A Representative EDL muscles electron micrographs of Ctrl and KO mice. B EDL muscle quantification of left: cristae number normalized to mitochondrial area; middle: mitochondrial area normalized to fiber area (m2); right: mitochondrial aspect ratio. Each dot represents a single mitochondrion analyzed, considering 10 mitochondria from 4 muscles per genotype at 3, 9 and 18mo. C Respiratory capacity in KO FDB myofibers compared to controls. Upper panel: representative traces, data shown as mean ± SEM. Lower panel: OCR quantification. Each dot represents a single FDB fiber analyzed (3mo: Ctrl n = 9, KO n = 8; 9mo: Ctrl n = 17, KO n = 16; 18mo: n = 12 Ctrl/KO). D Respiratory complex single enzyme activity normalized to citrate synthase activity. Each dot represents a single muscle analyzed (3mo: n = 4 Ctrl/KO; 9mo: n = 6 Ctrl/KO; 18mo: n = 7 Ctrl/KO). E Antioxidant enzymes mRNA levels in TA of 3, 9 and 18mo Ctrl and KO mice. PRX1 peroxiredoxin 1, GR1 glutathione reductase, CAT catalase, SOD1 and SOD2 superoxide dismutase 1 and 2. Each dot represents a single muscle analyzed (3mo: Ctrl n = 4; KO n = 7; 9mo and 18mo: n = 7 Ctrl/KO). F Left: Representative images of 3mo Ctrl and KO FDB fibers expressing SPLICSs-P2APO-MT probe. Co-localization of GFP fluorescent dots (SPLICS PO-MT) with anti-PMP70, labeling peroxisomes (PO), and anti-Tom20, labeling mitochondria (MT). Right: quantification of SPLICS PO-MT signal. Each dot represents a single FDB fiber analyzed (Ctrl n = 10; KO n = 15). G Number of PO-MT contacts in Ctrl and Pex5 KO HEK293 cells transfected with the SPLICS PO-MT probe. Each dot represents a single cell analyzed (Ctrl n = 48; KO n = 37). n = 3 replicates. H STED microscopy quantification of PMP70 and Tom20 colocalizing pixels per cell. Each point represents a single cell (Ctrl n = 55; KO n = 38). n = 3 replicates. Data are presented as violin plots (with individual data points). 3mo, 9mo and 18mo refer to samples from 3-, 9-, and 18-month-old mice. Two-sided Mann–Whitney test (B, F, G, and H), and multiple unpaired two-sided Welch’s t tests (CE) were used when comparing two groups. Source data are provided as a source data file.
Fig. 5
Fig. 5. Pex5 deletion in skeletal muscle results in early-onset muscle weakness, preceding muscle atrophy.
A Biological Processes (BP) and Cellular Components (CC) inhibited at 3mo. The Enrichment Score of each term is plotted. B Heatmap of 12 muscle contraction-related genes significantly inhibited in KO vs Ctrl GNM muscles at 3mo. C Amino acids concentration in GNM muscles from 3mo mice. Each dot represents a single muscle analyzed (Ctrl n = 4; KO n = 7). D Normalized force–frequency curve of Ctrl and KO mice at 3 and 18mo. Data shown as mean ± SEM. E Normalized maximal tetanic force. D, E Each dot represents a single muscle analyzed (3mo: Ctrl n = 7; KO n = 13; 18mo: Ctrl n = 6; KO n = 8). Fiber size distribution of control and KO TA muscle at 3 (F), 9 (G), and 18mo (H). Data shown as mean ± SEM in columns. 3mo: n = 4 Ctrl, n = 3 KO (F); 9mo: n = 7 Ctrl, n = 7 KO mice (G); 18mo: n = 6 Ctrl/KO mice (H). G p-value a = 0.0058, b = 0.0044, c = 0.0028. H p-value a = 0.0085, b = 0.0013, c = 0.0329, d = 0.0279, e = 0.0288, f = 0.0118. I mRNA levels of atrophy-related genes in TA muscle of 9mo control and KO mice. Left: ubiquitin-proteasome-related genes; middle: autophagy-related genes; right: ER stress-related genes. Each dot represents a single muscle (Ctrl n = 6; KO n = 5). J Fbxl22 mRNA levels in TA muscles at 3, 9, and 18 months. Each dot represents a single muscle (3mo: Ctrl n = 4; KO n = 7; 9mo: Ctrl n = 6; KO n = 5; 18mo: Ctrl n = 6, KO n = 7). K Running distance until exhaustion of Ctrl and KO mice at 3 and 18 months. Each dot represents a single mouse (3mo: Ctrl n = 5; KO n = 3; 18mo: Ctrl n = 5; KO n = 7). 3mo, 9mo and 18mo refer to samples from 3-, 9-, and 18-month-old mice. Unpaired two-sided Welch’s t tests (C, E lower panel, J), Mann–Whitney test (E upper panel), or multiple unpaired two-sided Welch’s t test (FI) used when comparing two groups. A two-way ANOVA with Sidak’s multiple comparisons test performed when comparing more than two groups (K). Source data are provided as a source data file.
Fig. 6
Fig. 6. Pex5-null muscles exhibit an early development of sarcopenic features.
A Left: representative Hematoxylin & Eosin staining of TA. Arrowheads: center nuclei in 9- and 18mo KO mice. Right. Quantification of fibers with center nuclei over total fiber number in muscle section. Each dot represents one single muscle (9mo: n = 7 Ctrl/KO; 18mo: Ctrl n = 8, KO n = 10). B Electron micrographs representative images showing ultrastructural defects in 18mo KO EDL muscle. C Representative images of modified Gomori trichrome staining of TA muscle from 18mo control and KO mice. D Left: Quantification of fibers with tubular aggregates (stained in red in (C)) relative to the total fiber number in muscle section of 18mo mice. Right: Quantification of aggregate area normalized to fiber area. Each dot represents one single muscle (Ctrl n = 6; KO n = 5). E Upper panel: immunoblot of total protein extracts from TA muscles of 18mo mice. Lower panel: Densitometric analysis. Data normalized to GAPDH. Each dot represents one single muscle (n = 7 Ctrl/KO). F Left: Representative image showing NCAM positive fibers in TA KO muscles at 18mo. Right: Quantification of NCAM-positive fibers relative to the total fiber number in the muscle section. Each dot represents one single muscle (Ctrl n = 8; KO n = 11). G Indirect immunofluorescence on EDL muscles. Magenta: post-synaptic AChRs stained with α-BTx; cyan: pre-synaptic compartment identified with anti-VAMP1 antibody. Asterisks identify denervated NMJs, arrows partial denervated ones. Scale bar: 50 µm. Magnification of innervated, partial denervated and denervated NMJs shown in the right panel (10 µm). H Quantification of innervated, partial denervated, and denervated NMJs in EDL of 18mo mice. Each dot represents one muscle (n = 3 Ctrl/KO), 30 NMJs analyzed/muscle. Unless otherwise stated, all data in this figure were obtained from the analysis of 18mo mice muscles. Data presented as violin plots (with individual data points). 3mo, 9mo and 18mo refer to samples from 3-, 9-, and 18-month-old mice. Unpaired two-sided Welch’s t tests (A, E, F), Two-sided Mann–Whitney test (D), and multiple unpaired two-sided Welch’s t tests (H) were used when comparing two groups). Source data are provided as a source data file.
Fig. 7
Fig. 7. Schematic overview of the phenotypical alterations observed in the muscle-specific Pex5 KO mouse model.
Upper panel: In control mice, a reduction in peroxisomal content, early mitochondrial alterations such as decreased mitochondrial cristae number, and reduced exercise performance are already evident by 18 months of age. These precede the age-related defects typically observed after 24 months, including further peroxisome loss, progressive mitochondrial dysfunction, and consequential impairments in muscle structure, metabolism, strength, and mass. The decline in muscle force and mass is known as sarcopenia. Lower panel: Pex5 deletion in skeletal muscle leads to abnormal peroxisomal assembly with impaired peroxisomal protein import (peroxisomal ghosts). These changes result in pexophagy flux impairment, altered lipid and amino acid metabolism, reduced mitochondria cristae number, early decline in muscle force, and reduced exercise performance by 3 months of age. Moreover, at this stage, peroxisome (PO)-mitochondria (MT) proximity is reduced, however, the causal or consequential nature of this relationship remains unclear. By 9 months, mitochondrial content is affected, characterized by reduced mitochondrial biogenesis and increased mitophagy. At 18 months, KO muscles exhibit mitochondrial dysfunction and an accelerated onset of age-related muscle atrophy and impairment, marked by the accumulation of tubular aggregates, proteolytic sarcomere breakdown, and neuromuscular junction degeneration. The alterations occurring earlier in KO mice compared to control mice are highlighted in red. Created in BioRender. DAVIGO, I. (2025) https://BioRender.com/bp2gfbd.
Fig. 8
Fig. 8. Progressive age-dependent alterations in peroxisomal content and size.
A Left: Muscle force assessed by grip test; right: TA fiber size assessed by CSA analysis. Each dot represents one mouse (left) or muscle (right) (n = 5 Ctrl/KO). B mRNA levels of peroxisomal genes involved in peroxisomal biogenesis (Pex1, Pex5, and Pex12), peroxisomal β-oxidation (ACOX1), and ROS detoxification (catalase (CAT)) in TA muscles from 3, and 26mo control mice. Each dot represents one muscle (3mo: n = 3 mice; 26mo: n = 4). C Upper panel: Immunoblot images of total TA muscle lysates from 3, 9, 18, and 26mo control mice, probed with anti-Pex5, PMP70, and MFP2, normalized to GAPDH levels. Lower panel: Densitometric quantification of Pex5, PMP70, and both the cytosolic 79 kDa and peroxisomal-processed 45 kDa (indicated at 43 kDa) forms of MFP2. Each dot represents one muscle (n = 4 per group). D Representative STED microscopy images of longitudinal sections of TA showing endogenous peroxisomes, immunostained with anti-PMP70, from 3, 18, and 26mo control mice. The 26 months panel shows two muscle fibers positioned side by side. E Quantification of the number of PMP70-positive structures normalized to muscle fiber area. Each dot represents a single TA muscle fiber analyzed (3mo: n = 69; 18mo: n = 73; 26mo: n = 54). Three muscles for each age were analyzed. Data are presented as violin plots (with individual data points). 3mo, 9mo,18mo, and 26mo refer to samples from 3-, 9-, 18-, and 26-month-old mice. Statistical tests: Unpaired two-sided Welch’s t tests (A); multiple unpaired two-sided Welch’s t tests (B); Brown–Forsythe and Welch ANOVA test (C); and non-parametric Kruskal–Wallis test (E). Source data are provided as a source data file.

References

    1. Argilés, J. M., Campos, N., Lopez-Pedrosa, J. M., Rueda, R. & Rodriguez-Mañas, L. Skeletal muscle regulates metabolism via interorgan crosstalk: roles in health and disease. J. Am. Med. Dir. Assoc.17, 789–796 (2016). - DOI - PubMed
    1. Piotrowicz, K., Gąsowski, J., Michel, J.-P. & Veronese, N. Post-COVID-19 acute sarcopenia: physiopathology and management. Aging Clin. Exp. Res.33, 2887–2898 (2021). - DOI - PMC - PubMed
    1. Srikanthan, P. & Karlamangla, A. S. Muscle mass index as a predictor of longevity in older adults. Am. J. Med.127, 547–553 (2014). - DOI - PMC - PubMed
    1. Newman, A. B. et al. Strength, but not muscle mass, is associated with mortality in the health, aging and body composition study cohort. J. Gerontol. A Biol. Sci. Med. Sci.61, 72–77 (2006). - DOI - PubMed
    1. Wanders, R. J. A., Waterham, H. R. & Ferdinandusse, S. Peroxisomes and their central role in metabolic interaction networks in humans. Sub Cell. Biochem.89, 345–365 (2018). - PubMed

Substances

LinkOut - more resources