. 2025 Nov 12;16(1):9397.
doi: 10.1038/s41467-025-65049-8.

A non-canonical lymphoblast in refractory childhood T-cell leukaemia

Affiliations

A non-canonical lymphoblast in refractory childhood T-cell leukaemia

Bram S J Lim et al. Nat Commun. .

Abstract

Refractory cancers may arise either through the acquisition of resistance mechanisms or represent distinct disease states. The origin of childhood T-cell acute lymphoblastic leukaemia (T-ALL) that does not respond to initial treatment, i.e. refractory disease, is unknown. Refractory T-ALL carries a poor prognosis and cannot be predicted at diagnosis. Here, we perform single cell mRNA sequencing of T-ALL from 58 children (84 samples) who did, or did not respond to initial treatment. We identify a transcriptionally distinctive blast population, exhibiting features of innate-like lymphocytes, as the major source of refractory disease. Evidence of such blasts at diagnosis heralds refractory disease across independent datasets and is associated with survival in a large, contemporary trial cohort. Our findings portray refractory T-ALL as a distinct disease with the potential for immediate clinical utility.


Conflict of interest statement

Competing interests: D.T.T. receives research funding from BEAM Therapeutics and Neoimmune Tech. D.T.T. serves on advisory boards (unpaid) for Amgen, BEAM Therapeutics, Novartis, Jazz, J&J Innovation, Pfizer, Sobi, Servier and Syndax. D.T.T. holds patents or has patents pending: “Biomarkers predictive of cytokine release syndrome” (US11747346) and “Compositions and methods comprising anti-CD38 chimeric antigen receptors” (US20250121004, pending). C.G.M. receives research funding from AbbVie and Pfizer. C.G.M. has a consulting role with Amgen and Illumina. C.G.M. receives royalties from Cyrus. The remaining authors declare no competing interests.

Figures
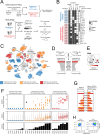
Fig. 1
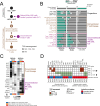
Fig. 1. ZBTB16 defines refractory blasts in T-ALL.
A Schematic illustrating the clinical course of T-ALL and overview of study design. Created in BioRender. Behjati, S. (2025) https://www.biorender.com/4eu223k. B Heatmap indicating data generated for each patient and clinical information (ETP status, induction outcome, genomic subtype). C UMAP (uniform manifold approximation and projection) of 216,507 cells, including 160,327 leukaemia blasts (coloured) and 56,180 normal cells (grey). Day 0 blasts from patients who responded to induction treatment (blue); day 0 blasts from patients with induction failure (orange); day 28 refractory blasts from patients with induction failure (red). Circles and arrows highlight that day 28 blasts from patients P030 and P058 clustered separately from their respective day 0 blasts on the UMAP. D Analytical schematic. Overlapping the top 100 upregulated genes of the day 28 blasts from the two patients (P030 and P058) yielded eight genes, of which ZBTB16 had the highest log-fold increase. E UMAP showing the expression of ZBTB16 in day 0 and day 28 blasts from P058. ZBTB16 expression is largely absent in day 0 blasts, apart from a small cluster (65/9668 blasts) indicated by an arrowhead, whereas most day 28 blasts expressed ZBTB16 (692/709 blasts). F ZBTB16 expression in blasts across 29 samples from 21 children with T-ALL. Samples comprise diagnostic day 0 blasts from responsive cases (8 children), diagnostic day 0 blasts from induction failure cases (13 children) and refractory day 28 blasts from induction failure cases (8 children). Top: Median ZBTB16 expression of each cluster of blasts within each sample; size of circle indicates cluster size; arrowhead indicates a small cluster of day 0 blasts from P058 expressing ZBTB16. Middle: Box plots and swarm plots of ZBTB16 expression at single-cell resolution. Box plots show the first and third quartiles (boxes), as well as median values (central lines). Whiskers extend to the most extreme values within 1.5 times the interquartile range above and below the boxes. Bottom: Fraction of blasts expressing ZBTB16. G ZBTB16 expression in blasts from induction failure patients with paired day 0 (orange) and day 28 samples (red). Left: Fraction of blasts expressing ZBTB16. Right: Median ZBTB16 expression in ZBTB16+ blasts. H Flow cytometry measurement of ZBTB16 in blasts from diagnostic samples of responsive patient P108 and induction failure patient P018. MRD minimal residual disease, scRNA-seq single cell mRNA sequencing, scTCR-seq single cell T-cell receptor sequencing, WGS whole genome sequencing, ETP early T-cell precursor, NK natural killer cell. Source data are provided as a Source Data file.
Fig. 2
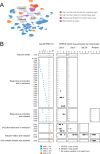
Fig. 2. ZBTB16 defines a non-canonical T-ALL cell state.
A Schematic illustrating the differentiation trajectory of T cells, natural killer (NK) cells and innate lymphoid cells (ILC), showing the approximate timepoints for rearrangement of TCR genes (TRD, TRG, TRB, TRA). B Normal-to-leukaemia transcriptome comparison by logistic regression. A logistic regression model was trained using ZBTB16+ blasts, ZBTB16− blasts, and neural crest cells which serve as control. This model was used to determine the similarity of query cell types (y-axis: conventional T cells, unconventional T cells, NK cells, ILC) to reference cell types (x-axis). C Heatmap showing expression of well-characterised cell type marker genes across ZBTB16+ and ZBTB16− blasts, taken from day 0 samples of responsive patients (blue), from day 0 samples of induction failure patients (orange), and from day 28 samples of induction failure patients (red). Expression values are log-normalised gene expression averaged across blasts within each group. Genes are known markers for conventional T cell lineages (top), and unconventional T cells, NK cells and ILC (bottom). D Heatmap showing the lack of association between ZBTB16 expression at diagnosis and TCR gene expression status determined by TRUST4 analysis of diagnostic single-cell mRNA sequencing data. ETP status and genomic subtype are indicated alongside. HSC haematopoietic stem cell, MPP multipotent progenitor, LMPP lymphoid-primed multipotent progenitor, MLP multi-lymphoid progenitor, ETP early T-cell precursor, TCR T-cell receptor. Source data are provided as a Source Data file.
Fig. 3
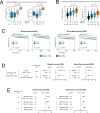
Fig. 3. ZBTB16 expression in scRNA-seq of validation cohort.
A UMAP (uniform manifold approximation and projection) of 333,487 cells, including 218,599 leukaemia blasts (coloured) and 114,888 normal cells (grey). Day 0, day 8 and day 28 blasts from patients who responded to induction treatment (blue), day 0 and day 8 blasts from patients with induction failure (orange), day 28 refractory blasts from patients with induction failure (red), and blasts found at relapse (purple). B Clinical outcome and ZBTB16 expression across our extension cohort of 37 unselected children (including longitudinal timepoints where available) from our institutional archives. The first panel from left shows day 28 MRD (%), coloured by MRD group, where patients are split along the y-axis by clinical outcome. The following panels show median ZBTB16 expression of each cluster of blasts within each sample across timepoints; filled circles are coloured grey if median ZBTB16 expression in that cluster of blasts is zero. L026 is a child with T-lymphoblastic lymphoma who was found by CT scan to have responded completely at day 28. MRD minimal residual disease. Source data are provided as a Source Data file.
Fig. 4
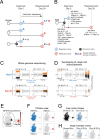
Fig. 4. Clinical validation of ZBTB16 signal in independent T-ALL cohorts.
A Box plots showing ZBTB16 expression (p = 2.4 × 10−4) and module score (p = 4.3 × 10−4) in bulk transcriptomes of an unpublished Princess Maxima Center cohort, plotted against day 28 MRD categories. The number of individuals per category is indicated by ‘n’. B Box plots showing ZBTB16 expression (p < 2.2 × 10−16) and module score (p < 2.2 × 10−16) in bulk transcriptomes of the published COG AALL0434 study, plotted against day 28 MRD categories. The number of individuals per category is indicated by ‘n’. C Overall survival and event-free survival in the COG AALL0434 cohort. Data were stratified into the top and bottom 33% of samples based on either their ZBTB16 expression or module score to test the association of these groups with overall survival and event-free survival using the Kaplan–Meier method. Error bands show 95% confidence intervals (CI 95%). D Hazard ratios (HR, central dots) and 95% confidence intervals (CI 95%, error bars) for various Cox proportional hazard (CoxPH) models of overall survival and event-free survival using the published COG AALL0434 study. Both ZBTB16 and immunophenotype-defined ETP status were tested as variables, where ZBTB16 was considered as tertiles as defined in (C), and ETP status was considered either excluding or including the “Near-ETP” label. Number of individuals in each CoxPH model is indicated by ‘N’. Statistically significant hazard ratios (p < 0.05) in black and non-significant ones in grey. E Hazard ratios (HR, central dots) and 95% confidence intervals (CI 95%, error bars) for various Cox proportional hazard (CoxPH) models of overall survival and event free survival using the published COG AALL0434 study. The ZBTB16 module score was tested against scores for each of the “BMP-like” gene signatures. Number of individuals in each CoxPH model is indicated by ‘N’. Statistically significant hazard ratios (p < 0.05) in black and non-significant ones in grey. Box plots show the first and third quartiles (boxes), as well as median values (central lines). Whiskers extend to the most extreme values within 1.5 times the interquartile range above and below the boxes. All box plot p values were calculated by a one-sided Wilcoxon rank-sum test. MRD minimal residual disease. Source data are provided as a Source Data file.
Fig. 5
Fig. 5. Origin of ZBTB16+ blasts in patient P058 with refractory T-ALL.
A Possible cancer phylogenies relating clone A at diagnosis (day 0) and clone B at reassessment (day 28). Top: Clone B directly derives from clone A, and therefore possesses all somatic mutations found in clone A, plus additional mutations gained in clone B; Middle: Clone B is completely independent of clone A and thus has a completely different set of somatic mutations; Bottom: Clone B and clone A share a common precursor, hence clone A and B share a common set of somatic mutations found in their common precursor, but each clone has also gained additional mutations of its own. B Leukaemia phylogeny in patient P058, delineating the diagnostic clone A (blue open circle) and the refractory clone B (red open circle). Both clones share a precursor clone (black filled circle). Importantly, clone B was present at diagnosis as a minor clone (small red filled circle). C Phased B allele frequency (BAF) of heterozygous single nucleotide polymorphisms (SNPs) on chromosome 9 (left column) and chromosome 17 (right column) in whole genome sequencing (WGS) of P058 samples at day 0 (top row) and day 28 (bottom row). Each dot denotes a SNP: major allele (orange), minor allele (black) and SNPs lying outside of the copy number altered segment (grey). D Phased BAF of SNPs on chromosome 9 (left column) and chromosome 17 (right column) in single cell transcriptomes of P058 blasts at day 0 (top row) and day 28 (bottom row). Each dot denotes a SNP where reads have been aggregated across all blasts in that sample: major allele (orange), minor allele (black) and SNPs lying outside of the copy number altered segment (grey). E UMAP (uniform manifold approximation and project) showing the expression of ZBTB16 in day 0 and day 28 blasts from P058. ZBTB16 expression is largely absent in the day 0 blasts, apart from a small cluster indicated by an arrowhead, whereas the day 28 blasts are strongly expressing ZBTB16. F UMAPs showing T-cell receptor (TCR) gene usage in day 0 and day 28 blasts from P058, determined by TRUST4 analysis of single cell mRNA sequencing data: TCR genes used by clone A (blue) and clone B (red). G UMAPs showing the presence of specific copy number changes (posterior probability ≥0.95) in day 0 and day 28 blasts from P058: chromosome 9 of the precursor clone (black) and chromosome 17 of clone A (blue). H UMAPs of day 0 and day 28 blasts from P058, showing the presence of at least one single nucleotide variant (SNV) associated with the precursor clone (black), clone A (blue) and clone B (red). Source data are provided as a Source Data file.
Fig. 6
Fig. 6. Potential cell surface targets in T-ALL.
A Derivation of two lists of potential antigen targets for (i) T-ALL blasts in general and (ii) refractory ZBTB16+ blasts specifically. Differential expression analysis between blasts and normal cells across our discovery and validation scRNA-seq cohorts provided blast-specific genes that were further filtered for cell surface targets. B Dotplot showing the expression of potential cell surface targets on cells from our T-ALL cohort (day 0 blasts, day 28 blasts, relapse blasts, and normal T cells and NK cells), as well as cells from a published single-cell atlas of the normal immune system which include: conventional T cells (T CD4/CD8, T naive/CM CD8, T naive/CM CD4, T naive/CM CD4 activated, Tfh, Tregs, T effector/EM CD4, Trm Th1/Th17, Trm gut CD8, Tem/emra CD8, Trm/em CD8), unconventional T cells (MAIT, Trm Tgd, Tgd CRTAM+), ILCs, and NK cells. Cell surface antigen targets include those derived from our study against T-ALL blasts in general and against refractory ZBTB16+ T-ALL blasts, as well as those which are currently under investigation.

References

    1. Hunger, S. P. & Mullighan, C. G. Acute lymphoblastic leukemia in children. N. Engl. J. Med.373, 1541–1552 (2015). - PubMed
    1. Malard, F. & Mohty, M. Acute lymphoblastic leukaemia. Lancet395, 1146–1162 (2020). - PubMed
    1. Goldberg, J. M. et al. Childhood T-cell acute lymphoblastic leukemia: the Dana-Farber Cancer Institute Acute Lymphoblastic Leukemia Consortium experience. JCO21, 3616–3622 (2003). - PubMed
    1. Coustan-Smith, E. et al. Early T-cell precursor leukaemia: a subtype of very high-risk acute lymphoblastic leukaemia. Lancet Oncol.10, 147–156 (2009). - PMC - PubMed
    1. Conter, V. et al. Early T-cell precursor acute lymphoblastic leukaemia in children treated in AIEOP centres with AIEOP-BFM protocols: a retrospective analysis. Lancet Haematol.3, e80–e86 (2016). - PubMed

MeSH terms

LinkOut - more resources