. 2025 Nov 11;7(4):e00073.
doi: 10.1097/IN9.0000000000000073. eCollection 2025 Oct.

Comparison of immunometabolic profiles in whole blood versus peripheral blood mononuclear cells

Affiliations

Comparison of immunometabolic profiles in whole blood versus peripheral blood mononuclear cells

Ibrahima Diallo et al. Immunometabolism (Cobham). .

Abstract

Background: Immunometabolism has emerged as a flourishing field exploring how cellular metabolism regulates immune responses. Peripheral blood mononuclear cells (PBMCs) have so far been the primary sample type used for immunometabolic profiling. However, PBMCs isolation requires large blood volumes, can pose logistic challenges, and requires specialized skills for processing. Thus, using whole blood (WB) samples, which are less technically challenging to process, could serve as a viable alternative for metabolic characterization of circulating immune cell populations. Yet, how well WB immunometabolic profiles match those from PBMCs remains unknown. Therefore, we aimed to compare the immunometabolic profile of WB with that of PBMCs.

Method: Paired WB and PBMCs samples were collected from six healthy donors. WB was collected in CryoStor®-CS10 medium, while PBMCs were isolated using Ficoll density gradient. Using spectral flow cytometry, we identified immune cell populations and assessed their metabolic states.

Results: Our findings show an overall high similarity in the immune cell subset frequencies between WB and PBMCs as well as their metabolic profiles. However, differences in the expression of certain metabolic markers were noted in some immune populations. Specifically, glucose transporter 1 levels were higher in CD8+ TEMRA, NKT, and NK cells from PBMCs, while ATP5a levels were higher in naïve CD4+ T cells from WB.

Conclusions: These results suggest that WB can be an alternative to PBMCs for metabolic profiling of immune cells. Nevertheless, for some specific cell subsets, caution should be taken when comparing immunometabolic data between WB and PBMCs.

Keywords: immunometabolic profiling; metabolic markers; metabolism; peripheral blood mononuclear cells; spectral flow cytometry; whole blood.


Conflict of interest statement

The authors declare that they have no conflict of interest.

Figures
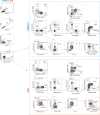
Figure 1.
Figure 1.
Gating strategies in FlowJo to identify identical immune populations in WB and PBMCs. Debarcoding CD45+ of WB and PBMCs for the same donor. Followed by manual gating strategies applied to identify T cell subsets: CD4+ T cells (central memory [CM], effector [EM], effector memory [EMRA], Naïve) and CD8+ T cells (central memory [CM], effector [EM], effector memory [EMRA], Naive); B cell subsets: (unswitched memory [USM], switched memory [SM], CD27IgD[DN], Naïve); NK cells (bright CD56 [CD56+CD16], dim CD56 [CD56CD16+] CD56+CD16+); myeloid cells (classical-, intermediate-, and non-classical monocytes as well as dendritic cells).
Figure 2.
Figure 2.
Immunophenotyping profiles in WB and PBMCs. (A) UMAP of PBMCs and WB overlaid after subsampling the same number of cells. UMAP shows a comparison of manual gating of major immune subsets and unsupervised clustering of PBMCs and WB from the same donor. Contour plots show the density distribution of cell populations. (B) Boxplots showing the frequency distribution of different immune cell subsets in WB and PBMCs. A paired t test was performed between WB and PBMCs, with multiple comparisons adjusted using the FDR correction (degrees of freedom, df = 4). FDR, false discovery rate; PBMCs, Peripheral blood mononuclear cells; UMAP, Uniform Manifold Approximation and Projection; WB, whole blood.
Figure 3.
Figure 3.
Immunometabolic profiles of WB and PBMCs. (A) UMAP, as shown in Figure 2B, in which expression levels of metabolic enzymes are shown (G6PD, ATP5a, SDHA, CD98, GLUT1, ACC1) in WB versus PBMCs. (B) PCA of WB and PBMCs from the same donor using the MFI of their metabolic enzyme markers. (C) Heatmap showing fold changes (WB/PBMCs) in enzyme expression across subsets with significant differences, determined by paired t test: GLUT1 (CD8+T cell EMRA [*], NKT [*], NK CD56+CD16+ [**]) and ATP5a (CD4+T cell naive [*]). (D) Parallel plots illustrating individual donor variation in enzyme expression for WB compared to PBMCs, where significant differences were observed (as shown in Figure 3C) by paired t test. (*) P < 0.5, (**) P < 0,01. ACC1, acetyl-CoA carboxylase 1; ATP5a, ATP synthase F1 subunit alpha; G6PD, glucose-6-phosphate dehydrogenase; GLUT1, glucose transporter 1; PBMCs, Peripheral blood mononuclear cells; SDHA, succinate dehydrogenase complex subunit A; UMAP, Uniform Manifold Approximation and Projection; WB, whole blood.

References

    1. O’Neill LA, Kishton RJ, Rathmell J. A guide to immunometabolism for immunologists. Nat Rev Immunol. 2016;16(9):553-65. - PMC - PubMed
    1. Finak G, Langweiler M, Jaimes M, et al. Standardizing flow cytometry immunophenotyping analysis from the human immunophenotyping consortium. Sci Rep. 2016;6(1):1-11. - PMC - PubMed
    1. Gao J, Luo Y, Li H, et al. Deep immunophenotyping of human whole blood by standardized multi-parametric flow cytometry analyses. Phenomics. 2023;3(3):309-28. - PMC - PubMed
    1. Brodin P, Duffy D, Quintana-Murci L. A call for blood—in human immunology. Immunity. 2019;50(6):1335-6. - PubMed
    1. Serra V, Orrù V, Lai S, et al. Comparison of whole blood cryopreservation methods for extensive flow cytometry immunophenotyping. Cells. 2022;11(9):1527. - PMC - PubMed

LinkOut - more resources