. 2025 Nov 13;53(21):gkaf1162.
doi: 10.1093/nar/gkaf1162.

Bacterial natural transformation drives cassette shuffling and simplifies recombination in chromosomal integrons

Affiliations

Bacterial natural transformation drives cassette shuffling and simplifies recombination in chromosomal integrons

Kevin Debatisse et al. Nucleic Acids Res. .

Abstract

Integrons act as biobanks of gene cassettes conferring functions crucial for bacterial defense, including protection against phages and antibiotics. They enable bacterial on-demand adaptation through capture and shuffling of the cassettes under stress conditions. Our results underscore the significant role of horizontal gene transfer in integron cassette recombination. We discover that sedentary chromosomal integrons (SCIs), such as those found in Vibrio cholerae, efficiently excise and recruit cassettes from linear single-stranded DNA fragments acquired during natural transformation. We propose a simplified mechanism for the cassette excision process from this type of substrates, requiring only a single strand exchange at the attC recombination sites, ruling out any replicative mechanism. We also observe a higher specificity of the V. cholerae integrase for attC recombination sites from the V. cholerae repeat-type, a trait differentiating SCI integrases from the mobile integron (MI) ones. This specificity, likely stemming from a long-term co-evolution between SCI integrases and attC sites, impedes the recruitment of cassettes from phylogenetically distant integrons. Collectively, our findings may explain the greater attC site homogeneity observed in SCIs compared to MIs and showcase the role of natural transformation in driving cassette shuffling and simplifying the cassette recombination mechanism, thereby expanding bacterial phenotypic diversity.


Conflict of interest statement

None declared.

Figures

Graphical Abstract
Graphical Abstract
Figure 1.
Figure 1.
The integron system. (A) The integron functioning. The components of the integron stable platform are shown: the integrase expressing gene, intI, the two promoters, PC and PINT and the attI recombination site (red triangle). The variable cassette array contains the cassettes represented by arrows (promoter-less gene) ended by triangles (attC sites). Their expression level is reflected by the color intensity of each arrow. Only the first cassettes of the array are expressed, and the subsequent ones can be seen as a low-cost cassette reservoir. Upon expression of the integrase (gray ovals), cassette shuffling can occur through cassette excision (attC × attC) and integration in the first position in the array (attI × attC). Cassettes excised from sedentary chromosomal integrons (SCIs) can be also integrated into mobile integron (MI) platforms or at attG sites carried by bacterial genomes. (Batt recombination sites. The double-stranded (ds) attI sites are shown. The single-stranded (ss) bottom strand (bs) of attC sites is shown. The structure of ss-attC bs was determined by the RNAfold program from ViennaRNA 2 package. The conserved nucleotides are indicated with the 5′-AAC-3′ triplet in red and the extra-helical bases (EHBs) highlighted by violet circles. For both attC and attI sites, green boxes show putative IntI binding sites (R and L boxes), and black arrows show the cleavage point. UCS and VTS stand for unpaired central spacer and variable terminal structure, respectively. R, Y, and N stand for purine, pyrimidine and any base, respectively.
Figure 2.
Figure 2.
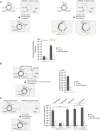
Cassette excision assays using the IntI1 integrase. (A) Experimental setup of the nonreplicative cassette excision assay. The pSW23T suicide vector carrying the att sites is delivered by transformation into the pir- UB5201 E. coli recipient strain. The recipient strain contains a plasmid expressing, or not, the integron integrase (IntI1, in gray) and a second plasmid carrying or not an attCereA2 site (right and left panel respectively). The inducible PTAC promoter and the pir116 gene are each represented by a black arrow. The att sites carried by the suicide vector and the recipient plasmid are represented by triangles. Phenotypic resistances to chloramphenicol (CmR) and kanamycin (KmR) are represented by gray rectangles and, the oriR6K and orip15A by respectively purple and blue circles. The graph representing the RFs obtained in several conditions is shown (bottom panel). The receptor plasmids are indicated at the top of the bars. The used recombination sites (attI1 × attCaadA7) are indicated in the axis-x legend. (B) Experimental setup of the replicative cassette excision assay. The pSW23T suicide vector carrying the att sites is contained into the pir + UB5201 E. coli recipient strain. This strain ensures the pSW23T plasmid replication. The recipient strain also contains a plasmid expressing, or not, the integron integrase (IntI1, in gray). After recombination, plasmids were extracted and transformed in a nonpermissive pir- DH5α E. coli strain for Cm selection. The graph representing the excision frequencies is shown (right panel). The used recombination sites (attI1 × attCaadA7) are indicated in the axis-x legend. (C) Experimental setup of the suicide conjugation cassette excision assay. The setup is the same as in Fig. 2A, except that the pSW23T suicide vector plasmid containing the att sites is delivered by conjugation from the pir+ β2163 E. coli strain in the pir- MG1655 E. coli recipient strains. The recipient strain contains a plasmid expressing, or not, the integron integrase (IntI1, in gray). The graph representing all the excision frequencies obtained in several conditions is shown (right panel). The injected strands are indicated at the top of the bars. The used recombination sites (attI1 × attCaadA7 or attCaadA7 × VCR130) are indicated in the axis-x legend. The presence (RecA+) or absence of RecA (RecA−) is indicated. For panels (A), (B), and (C), IntI1 refers to a E. coli strain expressing the IntI1 integrase, whereas no IntI1 denotes its absence. Asterisk (*) indicates that the RF was below detection level, indicated by the bar height (limit of detection). Bar charts show the geometric mean of at least three independent experiments (n ≥ 3, individual plots) and error bars show the geometric standard deviation.
Figure 3.
Figure 3.
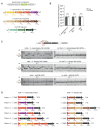
Natural transformation cassette recombination assay using the IntIA integrase and VCR-containing fragments. (A) Experimental setup of the co-transformation assay. DNA substrates used for co-transformation are depicted on the top. Each cassette is represented by a different color and each distinct VCR site is indicated and numbered. The aadA7 resistance gene marker, used for selection, is represented in light green. The legend for the integron platform is the same as in the Fig. 1A. Co-transformants are selected on Sp-containing plates. Two outcomes are possible: either no integration occurs into the attIA site (nonrecombinant clones, left) or integration occurs through a VCR × attIA recombination event (recombinant clones, right). (B) Natural transformation frequency of the Sp co-fragment. The graph representing all the natural transformation frequencies obtained in several conditions is shown. The used DNA fragments are indicated in the axis-x legend. IntIA refers to a V. cholerae strain expressing the wild-type IntIA integrase and, IntIAY302F to a V. cholerae strain expressing the catalytically mutated (Y302F) IntIA integrase, whereas no IntIA denotes its absence. Bar charts show the mean of at least three independent experiments (≥ 3, individual plots) and error bars show the standard deviation. Statistical comparisons (Student’s t-test, two-tailed) are as follows: ns, not significant. (C) PCR analysis of cassette integration into the attIA site in individual clones. Brown arrows indicate the primers used for PCR amplification. PCR results from 72 randomly selected clones (24 per replicate) for the IntIA-expressing strain (IntIA) and the IntIA nonexpressing strain (no IntIA) are shown on the left and right panels, respectively. If no cassette is integrated into the attIA site, the expected PCR product size is 0.8 kb while integration of one or more cassettes leads to a larger band (>0.8 kb) on the gel. The ratio of recombinant clones for the three replicates is indicated above the gels. (D) Schematic representation of Sanger sequencing results from recombinant clones. Successful sequencing was obtained from 37 PCR products. The six most prevalent patterns are shown.
Figure 4.
Figure 4.
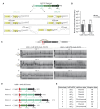
Natural transformation cassette recombination assay using the IntIA integrase and several attC sites-containing fragments. (A) DNA substrates used for the co-transformation assay. DNA substrates used for co-transformation are depicted. Each cassette is represented by a different color and each distinct attC site is indicated and arbitrarily numbered. attC stands for attC sites from the In40 MI. The aadA7 resistance gene marker, used for selection, is represented in light green. (B) Natural transformation frequency of the Sp co-fragment. The graph representing all the natural transformation frequencies obtained in several conditions is shown. The used SCI and MI DNA fragments are indicated in the axis-x legend. IntIA refers to a V. cholerae strain expressing the IntIA integrase, whereas no IntIA denotes its absence. Bar charts show the mean of three independent experiments (= 3, individual plots) and error bars show the standard deviation. Statistical comparisons (Student’s t-test, two-tailed) are as follows: ns, not significant. (C) PCR analysis of cassette integration into the attIA site in individual clones. Brown arrows indicate the primers used for PCR amplification. PCR results from 24 randomly selected clones (1 replicate per DNA substrate) for the IntIA-expressing strain (IntIA) and the IntIA nonexpressing strain (no IntIA) are shown on the left and right panels, respectively. If no cassette is integrated into the attIA site, the expected PCR product size is 0.8 kb while integration of one or more cassettes leads to a larger band (>0.8 kb) on the gel. The ratio of recombinant clones for the three replicates is indicated above each gel. (D) Schematic representation of Sanger sequencing results from recombinant clones. Successful sequencing was obtained from 28 and 18 PCR products using the V. metschnikovii and the V. fischeri fragments, respectively. The six most prevalent integration patterns are shown.
Figure 5.
Figure 5.
Natural transformation cassette recombination assay using the IntI1 integrase. (A) Experimental setup of the co-transformation assay. DNA substrates used for co-transformation are depicted on the top. Each cassette is represented by a different color and each distinct VCR or attC sites are indicated and numbered. The cat resistance gene marker, used for selection, is represented in golden brown. The PBAD promoter is indicated by a black arrow. In this strain, intIA is deleted from chromosome 2, and an attI1 site is present on chromosome 1. A plasmid-borne intI1 gene allows arabinose-inducible expression. Co-transformants are selected on chloramphenicol (Cm) -containing plates. Two outcomes are possible: either no integration occurs into the attI1 site (nonrecombinant clones, left) or integration occurs through a VCR (or attC) × attI1 recombination event (recombinant clones, right). (B) Natural transformation frequency of the Cm co-fragment. The graph representing all the natural transformation frequencies obtained in several conditions is shown. The used DNA fragments are indicated in the axis-x legend. IntI1 refers to a V. cholerae strain expressing the IntI1 integrase, whereas no IntI1 denotes its absence. Bar charts show the mean of three independent experiments (= 3, individual plots) and error bars show the standard deviation. Statistical comparisons (Student’s t-test, two-tailed) are as follows: ns, not significant. (C) PCR analysis of cassette integration into the attI1 site in individual clones. Brown arrows indicate the primers used for PCR amplification. PCR results from 24 randomly selected clones (1 replicate per DNA substrate) for the IntI1-expressing strain (IntI1) and the IntI1 nonexpressing strain (no IntI1) are shown on the left and right panels, respectively. If no cassette is integrated into the attI1 site, the expected PCR product size is 0.9 kb while integration of one or more cassettes leads to a larger band (>0.9 kb) on the gel. The ratio of recombinant clones for the three replicates is indicated above each gel. (D) Schematic representation of Sanger sequencing results from recombinant clones. Successful sequencing was obtained for 43 and 38 PCR products using the V. cholerae and in the In40 fragments, respectively. The six most prevalent integration patterns are shown.
Figure 6.
Figure 6.
Phylogenetic relationships and predicted secondary structures of attC, VCR, VFR, and VMR recombination sites. (A) Phylogenetic tree illustrating the evolutionary relationships and sequence divergence among the 20 tested recombination sites: attC1–4, VCR5–10, VFR1–5 and VMR1–5. Branch lengths are scaled to substitutions per site, with the scale bar representing 1 substitutions per site. Each recombination site is color-coded: green for attC, orange for VFR, red for VCR, and blue for VMR. (B) Predicted secondary structure of the ss bs of the recombination sites. The structure of ss-attC bs was determined by the RNAfold program from ViennaRNA 2 package. The conserved nucleotides are indicated with the 5′-AAC-3′ triplet in red and the EHBs highlighted by violet circles. Green boxes show putative IntI binding sites, and black arrows show the cleavage point.
Figure 7.
Figure 7.
Natural transformation cassette recombination assay using the IntIA integrase and modified In40 MI fragments. (A) DNA substrates used for the co-transformation assay. In40 DNA fragment used for co-transformation is depicted. Each cassette is represented by a different color and each distinct attC site is indicated and numbered. Predicted secondary structure of the ss bs of attC1 and attC2 are represented. UCS mod. stands for UCS modified and VTS mod. stands for VTS modified. Violet circles indicate EHBs in folded attC sites; green boxes highlight putative IntI binding sites (L and R boxes); and black arrows show the cleavage point. Structures were predicted using RNAfold from ViennaRNA 2 package (see the ‘Materials and methods’ section). (B) Natural transformation frequency of the Sp co-fragment. The graph representing all the natural transformation frequencies obtained in several conditions is shown. The used In40 fragments are indicated in the axis-x legend. IntIA refers to a V. cholerae strain expressing the IntIA integrase, whereas no IntIA denotes its absence. Bar charts show the geometric mean of three independent experiments (= 3, individual plots) and error bars show the geometric standard deviation. Statistical comparisons (Student’s t-test, two-tailed) are as follows: ns, not significant. (C) PCR analysis of cassette integration into the attIA site in individual clones. Brown arrows indicate the primers used for PCR amplification. PCR results from 72 randomly selected clones (24 per replicate) for the IntIA-expressing strain (IntIA) using the UCS mod. and VTS mod. fragments are shown on the left and right panels, respectively. If no cassette is integrated into the attIA site, the expected PCR product size is 0.8 kb while integration of one or more cassettes leads to a larger band (>0.8 kb) on the gel. The ratio of recombinant clones for the three replicates is indicated above the gels. (D) Schematic representation of Sanger sequencing results from recombinant clones. Successful sequencing was obtained from 12 PCR products using the In40 UCS mod. fragment. The four obtained integration patterns are shown. (E) Summary analysis of the In40 attC homologs in Vibrionaceae. The eight homologs found for In40 attC sites are indicated, with their localization (replicon type and integron type).
Figure 8.
Figure 8.
The one-step recombination mechanism. Recombination between ds and ss cassettes are shown. Cassettes are represented by light gray lines, attI sites by red ones and attC by green ones. The origin of replication is represented by a light gray circle. The synaptic complex comprises two DNA duplexes bound by four integrase protomers. The two activated protomers are represented by dark gray ovals. One strand from each duplex is cleaved and transferred to form an aHJ. The proposed aHJ resolution model is based on the attC × attI and the attC × attC recombination events. The replicative pathway from ds cassettes generates, on one hand, the initial substrate resulting from the top strand replication, and on the other, the excised cassette and the molecule devoid of the excised cassette (product) both resulting from the bs replication. The one-step nonreplicative pathway from ss cassettes generates the excised cassette and the molecule devoid of the excised cassette (product) both resulting from simple releasing.

References

    1. Escudero JA, Loot C, Nivina A et al. The Integron: adaptation on demand. Microbiol Spectr. 2015;3:MDNA3–0019-2014. - PubMed
    1. Escudero JAL C, Mazel D. In: Rampelotto PH (ed.), Molecular Mechanisms of Microbial Evolution, 2018, 199–239.
    1. Richard E, Darracq B, Loot C et al. Unbridled integrons: a matter of host factors. Cells. 2022;11:925. 10.3390/cells11060925. - DOI - PMC - PubMed
    1. Carvalho A, Hipolito A, Trigo da Roza F et al. The expression of integron arrays is shaped by the translation rate of cassettes. Nat Commun. 2024;15:9232. 10.1038/s41467-024-53525-6. - DOI - PMC - PubMed
    1. Guerin E, Cambray G, Sanchez-Alberola N et al. The SOS response controls integron recombination. Science. 2009;324:1034. 10.1126/science.1172914. - DOI - PubMed

MeSH terms

LinkOut - more resources