[Preprint]. 2025 Oct 5:rs.3.rs-7713987.
doi: 10.21203/rs.3.rs-7713987/v1.

Mutant MAPT Induces rDNA Transcriptional Hyperactivation and Nucleolar Stress in Cellular Models

Affiliations

Mutant MAPT Induces rDNA Transcriptional Hyperactivation and Nucleolar Stress in Cellular Models

Zaid Muhammad et al. Res Sq. .

Abstract

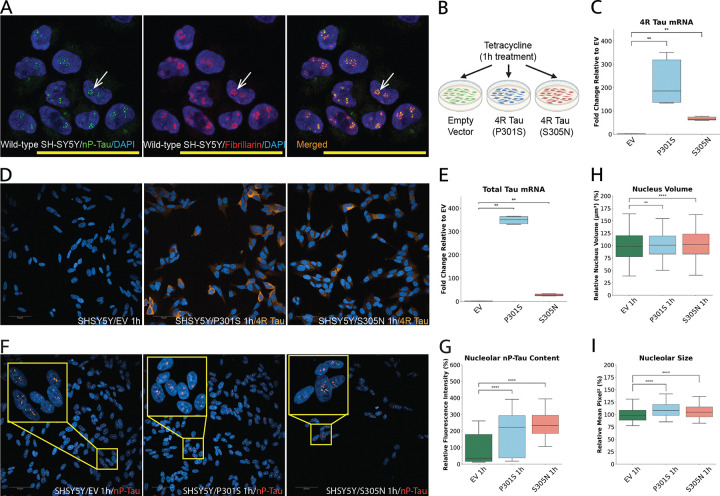
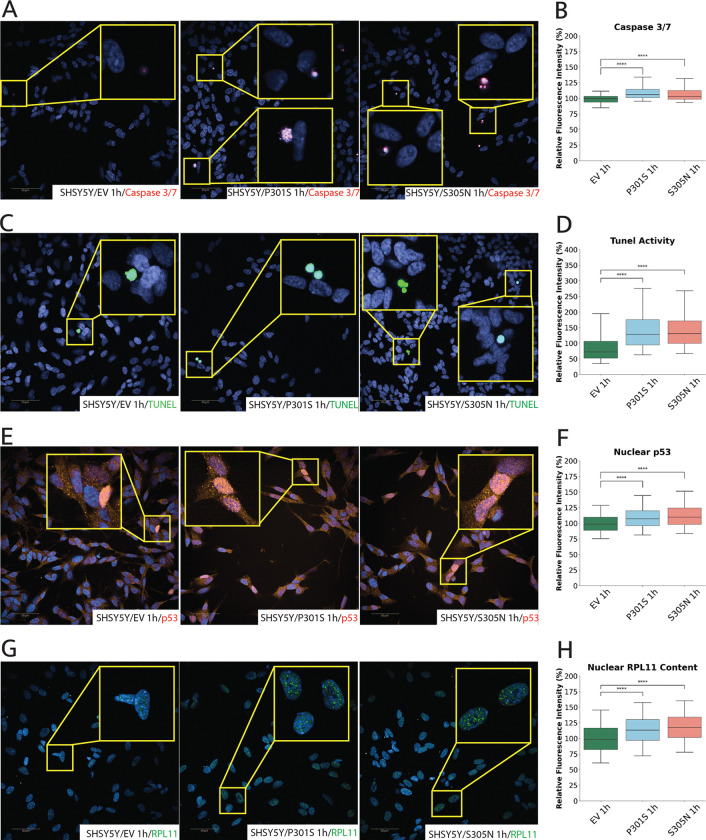
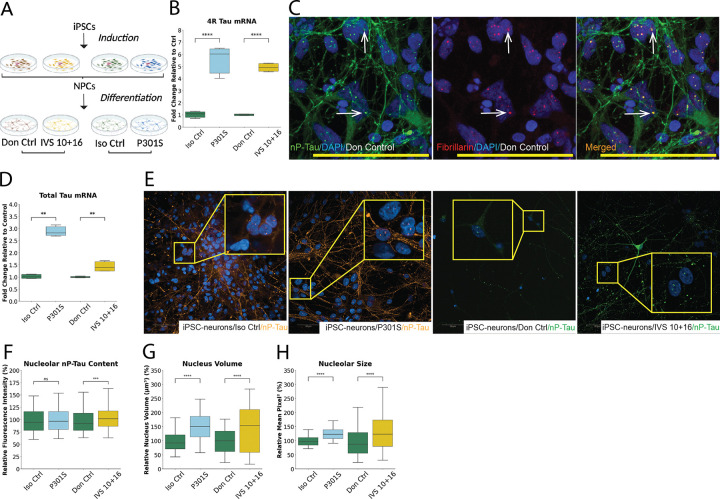
Tau is traditionally known for its role in microtubule stabilization, with its pathological aggregation central to tauopathies such as Alzheimer's disease (AD) and frontotemporal dementia (FTD). Recent evidence suggests that tau also plays important nuclear and nucleolar roles, yet the implications of tau pathology on nucleolar function remain poorly understood. Here, we show that tau localises to the nucleolus in both differentiated SH-SY5Y cells and iPSC-derived neurons, and accumulates upon expression of disease-associated MAPT mutations (P301S, S305N, and IVS 10 + 16). Using high-content imaging, we demonstrate that mutant tau expression leads to structural expansion of the nucleus and nucleolus, with upregulation of key markers from all three nucleolar sub-compartments, indicating increased in nucleolar activity. qPCR and nucleolar RNA-selective dye staining confirmed increased rDNA transcription and rRNA processing, suggesting that mutant tau drives elevated nucleolar biosynthetic output. This hyperactivation is accompanied by hallmarks of nucleolar stress and apoptosis, including p53 stabilisation, caspase 3/7 activation, and TUNEL positivity. These findings identify nucleolar dysfunction as a downstream consequence of mutant tau expression and highlight disruption of nucleolar homeostasis as a potential contributor to tau-mediated neurotoxicity in MAPT-linked FTD.


Conflict of interest statement

Declarations Conflict of Interest: All authors declare no competing financial or non-financial interests in relation to the work described in this manuscript.

Figures

Figure 1
Figure 1. Mutant MAPT Expression Increases Nuclear and Nucleolar Volumes in SH-SY5Y Cells.
(A) Immunofluorescence images showing colocalisation of non-phosphorylated tau (nP-Tau, green) with the nucleolar marker fibrillarin (FBL, red) in wild-type SH-SY5Y cells treated with retinoic acid (RA). DAPI (blue) marks nuclei. Arrows highlight nucleolar localisation of nP-Tau. (B) Schematic overview of the experimental set-up using a tetracycline-inducible system to express 4-repeat (4R) tau isoforms (P301S or S305N) or empty vector (EV) in RA-treated SH-SY5Y cells, following 1-hour tetracycline induction. (C) qPCR analysis confirming induced expression of MAPT 4R transcripts in P301S and S305N cells compared to EV, normalised to β-actin and RSP27, and expressed as fold change relative to EV. (D) Representative fluorescence images confirming robust 4R tau protein expression in mutant cells using a 4R isoform-specific antibody. (E) Total MAPT transcript levels (all isoforms) were also significantly increased in mutant cells, aligning with the 4R-specific findings. (F) Representative images and insets showing nucleolar localization of nP-Tau in EV, S305N, and P301S cells. (G) Quantification reveals significantly increased nucleolar nP-Tau content in mutant lines. High-content morphometric analyses show significantly increased nuclear volumes (H) and nucleolar sizes (I) in P301S and S305N cells relative to EV. Data represent mean ± SEM from ≥3 independent experiments, with ≥2,000 cells analyzed per condition and per experiment in high-content imaging experiments. Statistical comparisons were performed using two-sided Mann–Whitney U test with Bonferroni correction, following Shapiro–Wilk normality testing. *P < 0.05, **P < 0.01, ***P < 0.001, ***P < 0.0001. Scale bars: 10 μm (A); 50 μm (D, F).
Figure 2
Figure 2. Mutant MAPT Expression Upregulates rDNA Transcription, Processing, and Nucleolar Activity in SH-SY5Y Cells.
(A–F) Representative immunofluorescence images and corresponding quantifications of nucleolar protein content in tetracycline-induced SH-SY5Y cells expressing MAPT variants. (A–B) Upstream Binding Factor (UBF; green), a marker of the fibrillar center (FC) and key regulator of rDNA transcription, shows significantly increased nucleolar fluorescence intensity in both P301S and S305N cells relative to EV controls. (C–D) Fibrillarin (FBL; red), a marker of the dense fibrillar component (DFC) and essential for early rRNA processing, is markedly upregulated in mutant cells. (E–F) Nucleophosmin (NPM; green), a granular component (GC) protein involved in ribosome assembly, is also significantly elevated in both mutant lines. (H–I) Global nucleolar RNA content, assessed using Nucleolar Bright Green (NBG) dye, is significantly increased in mutant cells, indicating enhanced transcriptional activity. (J-L) qPCR analysis confirms upregulation of 45S pre-rRNA and its processed products (28S and 18S rRNA), indicating that MAPT mutations drive rDNA hyperactivation; transcript levels were normalized to β-actin and RSP27 and expressed as fold change relative to EV controls. (M–N) Nascent protein synthesis, measured by O-propargyl-puromycin (OPP) incorporation, shows a modest but significant increase in both mutant lines. Data represent mean ± SEM from ≥3 independent experiments, with ≥2,000 cells analyzed per condition and per experiment in high-content imaging experiments. Statistical comparisons were performed using two-sided Mann–Whitney U test with Bonferroni correction, following Shapiro–Wilk normality testing. *P < 0.05, **P < 0.01, ***P < 0.001, ****P < 0.0001. Scale bars: 50 μm.
Figure 3
Figure 3. Mutant MAPT Expression Induces Nucleolar Stress and Apoptotic Signaling in SH-SY5Y Cells.
(A–D) High-content immunofluorescence imaging and quantification of apoptotic markers in SH-SY5Y cells expressing MAPT mutants following tetracycline induction. (A–B) Caspase 3/7 activity (red), a key effector of apoptosis, is modestly but significantly elevated in both P301S and S305N cells compared to EV controls. (C–D) TUNEL assay (green), which detects DNA fragmentation, confirms increased apoptotic activity in mutant lines, consistent with early-stage cell death. (E–F) Nuclear p53 levels (red), a central stress response protein stabilized during nucleolar stress, are significantly upregulated in both mutant lines. (G–H) Immunolabeling of RPL11 (green), a ribosomal protein that participates in nucleolar stress, shows increased nuclear accumulation in P301S and S305N cells, supporting activation of the nucleolar stress response. Data represent mean ± SEM from ≥3 independent experiments, with ≥2,000 cells analyzed per condition and per experiment in most high-content imaging datasets. Statistical comparisons were performed using two-sided Mann–Whitney U test with Bonferroni correction, following Shapiro–Wilk normality testing. *P < 0.05, **P < 0.01, ***P < 0.001, ****P < 0.0001. Scale bars: 50 μm.
Figure 4
Figure 4. Mutant MAPT Expression Increases Nuclear and Nucleolar Volumes in iPSC-Derived Neurons
(A) Schematic overview of the iPSC-to-neuron differentiation workflow highlighting four genotypes: isogenic control (Iso Ctrl), MAPT P301S mutant, donor control (Don Ctrl), and the intronic splicing variant (IVS 10+16). (B) Immunofluorescence images showing colocalization of non-phosphorylated Tau (nP-Tau, green) with the nucleolar marker fibrillarin (FBL; red) in DAPI-stained nuclei (blue) of iPSC-derived neurons from Don Ctrl. Arrows indicate nucleolar localisation of nP-Tau. qPCR analysis shows a significant increase in 4R tau (C) and total tau (D) transcript levels in both P301S and IVS 10+16 neurons relative to their respective controls, normalized to β-actin and RSP27 and shown as fold change. (E) Representative images display nuclear and nucleolar nP-Tau patterns across genotypes, with magnified insets. (F) Quantification of nucleolar nP-Tau intensity shows increases in both mutant lines. High-content morphometric analysis shows substantial increases in nuclear volume (G) and nucleolar size (H) in both P301S and IVS 10+16 neurons compared to their controls. Data represent mean ± SEM from ≥3 independent experiments with ≥1,000 cells per condition and per experiment. Statistical comparisons were performed using two-sided Mann–Whitney U test after Shapiro–Wilk normality testing. *P < 0.05, **P < 0.01, ***P < 0.001, ****P < 0.0001. Neurons from P301S and Iso Ctrl lines were analyzed at 75 days in culture, and neurons from Don Ctrl and IVS 10+16 lines at 50 days. Culture duration was calculated from the first day of NPC induction. Scale bars: 10 μm (B); 50 μm (E).
Figure 5
Figure 5. Mutant MAPT Expression Upregulates rDNA Transcription, Processing, and Nucleolar Activity in iPSC-Derived Neurons
(A–F) Immunofluorescence images and quantitative analysis of nucleolar proteins in iPSC-derived neurons from four genotypes: isogenic control (Iso Ctrl), MAPT P301S mutant, donor control (Don Ctrl), and the MAPT IVS 10+16 intronic splicing variant. (A–B) Upstream Binding Factor (UBF; red), a marker of the fibrillar center (FC) involved in rDNA transcription, shows elevated nucleolar accumulation, particularly in IVS 10+16 neurons. (C–D) Fibrillarin (FBL; green), a dense fibrillar component (DFC) marker involved in rRNA processing, is significantly increased in both P301S and IVS 10+16 neurons; IVS 10+16 neurons also show diffuse nucleoplasmic FBL staining, a morphological hallmark of nucleolar stress. (E–F) Nucleophosmin (NPM; green), a granular component (GC) marker involved in ribosome assembly, displays significantly increased nucleolar localization in both mutant groups. qPCR analysis reveals significantly increased expression of 45S pre-rRNA (G), a marker of active rDNA transcription, and its processed products 28S (H) and 18S (I) rRNA in mutant lines. All expression levels were normalized to β-actin and RSP27 and presented as fold changes relative to respective control genotypes. Data represent mean ± SEM from ≥3 independent experiments, with ≥1,000 cells analyzed per genotype and per experiment. Statistical comparisons were performed using two-sided Mann–Whitney U test after Shapiro–Wilk normality testing. *P < 0.05, **P < 0.01, ***P < 0.001, ****P < 0.0001. Neurons from P301S and Iso Ctrl lines were analyzed at 75 days in culture, and neurons from Don Ctrl and IVS 10+16 lines at 50 days. Culture duration is calculated from the first day of NPC induction. Scale bars: 50 μm.
Figure 6
Figure 6. Mutant MAPT Expression Induces Nucleolar Stress and Apoptotic Signalling in iPSC-Derived Neurons
(A–B) Immunofluorescence imaging and quantification of nucleolar stress and apoptosis markers in iPSC-derived neurons from isogenic control (Iso Ctrl), MAPT P301S mutant, donor control (Don Ctrl), and MAPT IVS 10+16 splicing variant lines. (A–B) RPL11 (orange), a ribosomal protein that accumulates in the nucleoplasm under nucleolar stress, displays markedly increased nucleoplasmic localization in neurons from P301S and IVS 10+16 lines. Cell morphologies were visualized using nP-Tau (green). (C–D) Caspase 3/7 activation (red, within DAPI stained nuclei), a marker of apoptosis, is significantly elevated in P301S and IVS 10+16 neurons compared to controls. Data represent mean ± SEM from ≥3 independent experiments, with a minimum of 1,000 cells analyzed per genotype, per experiment. *P < 0.05, **P < 0.01, ***P < 0.001, ****P < 0.0001. Neurons from P301S and Iso Ctrl lines were analyzed at 75 days in culture, and neurons from Don Ctrl and IVS 10+16 lines at 50 days. Culture duration is calculated from the first day of NPC induction to the day of analysis. Scale bars: 50 μm.

References

    1. Weingarten M. D., Lockwood A. H., Hwo S. Y. & Kirschner M. W. A protein factor essential for microtubule assembly. Proc Natl Acad Sci U S A 72, 1858–1862 (1975). 10.1073/pnas.72.5.1858 - DOI - PMC - PubMed
    1. Brion J. P., Couck A. M., Passareiro E. & Flament-Durand J. Neurofibrillary tangles of Alzheimer’s disease: an immunohistochemical study. J Submicrosc Cytol 17, 89–96 (1985). - PubMed
    1. Kosik K. S., Joachim C. L. & Selkoe D. J. Microtubule-associated protein tau (tau) is a major antigenic component of paired helical filaments in Alzheimer disease. Proc Natl Acad Sci U S A 83, 4044–4048 (1986). 10.1073/pnas.83.11.4044 - DOI - PMC - PubMed
    1. Grundke-Iqbal I. et al. Abnormal phosphorylation of the microtubule-associated protein tau (tau) in Alzheimer cytoskeletal pathology. Proc Natl Acad Sci U S A 83, 4913–4917 (1986). 10.1073/pnas.83.13.4913 - DOI - PMC - PubMed
    1. Spillantini M. G. & Goedert M. Tau protein pathology in neurodegenerative diseases. Trends Neurosci 21, 428–433 (1998). 10.1016/s0166-2236(98)01337-x - DOI - PubMed

Publication types

LinkOut - more resources