[Preprint]. 2025 Oct 1:2025.10.01.679739.
doi: 10.1101/2025.10.01.679739.

Pathogen-Phage Geomapping to Overcome Resistance

Affiliations

Pathogen-Phage Geomapping to Overcome Resistance

Camilla Do et al. bioRxiv. .

Abstract

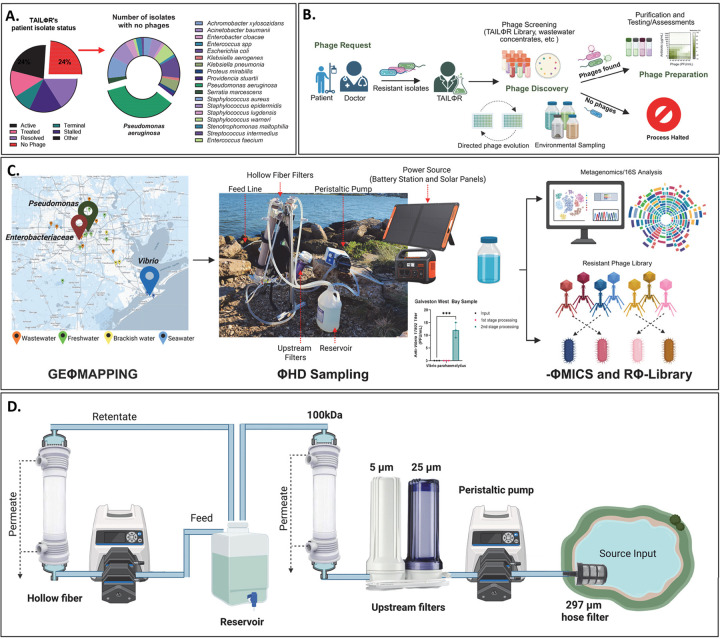
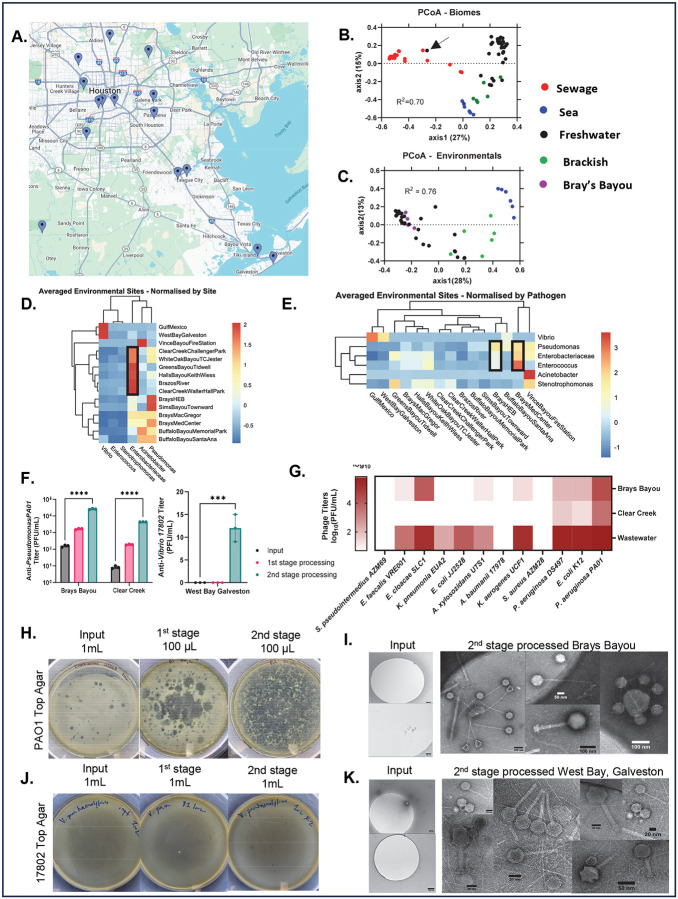
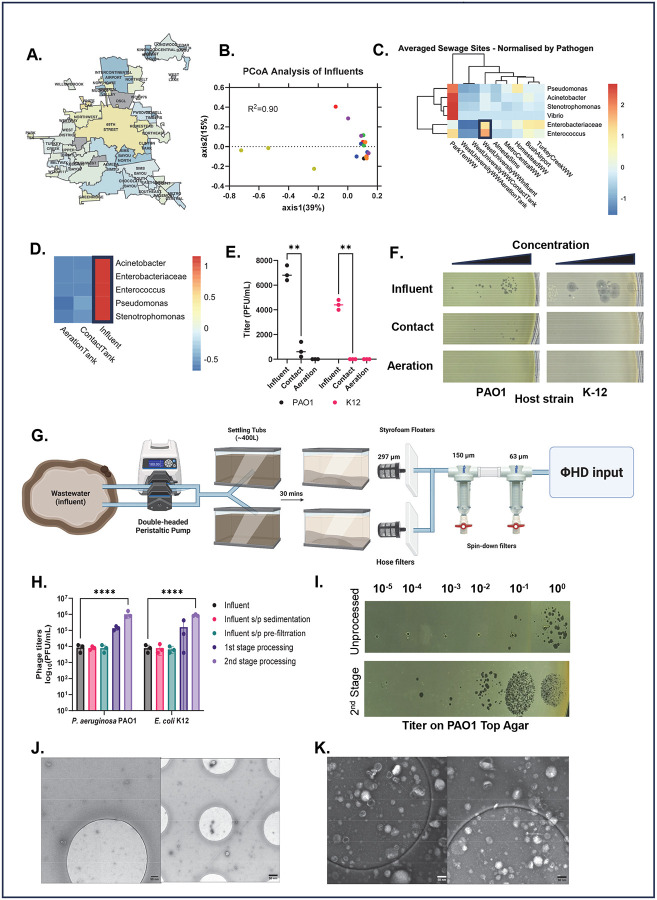
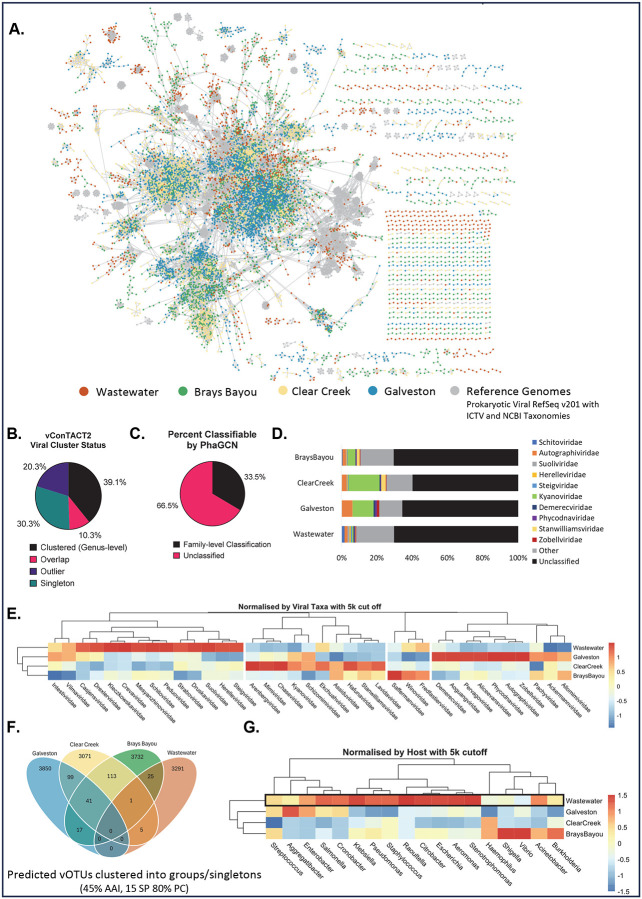
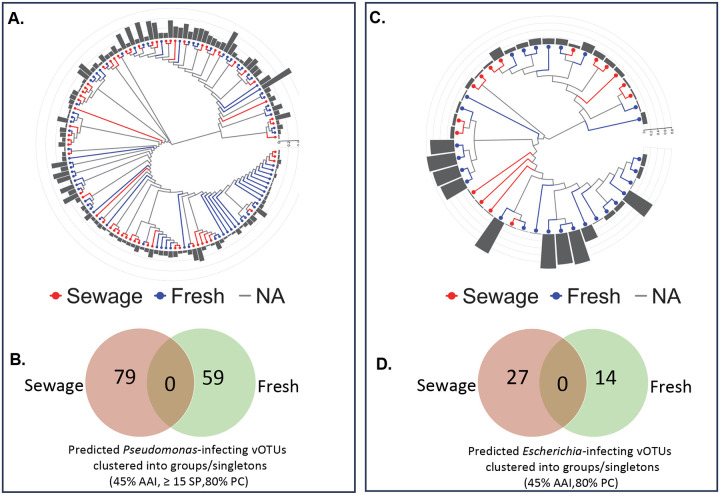
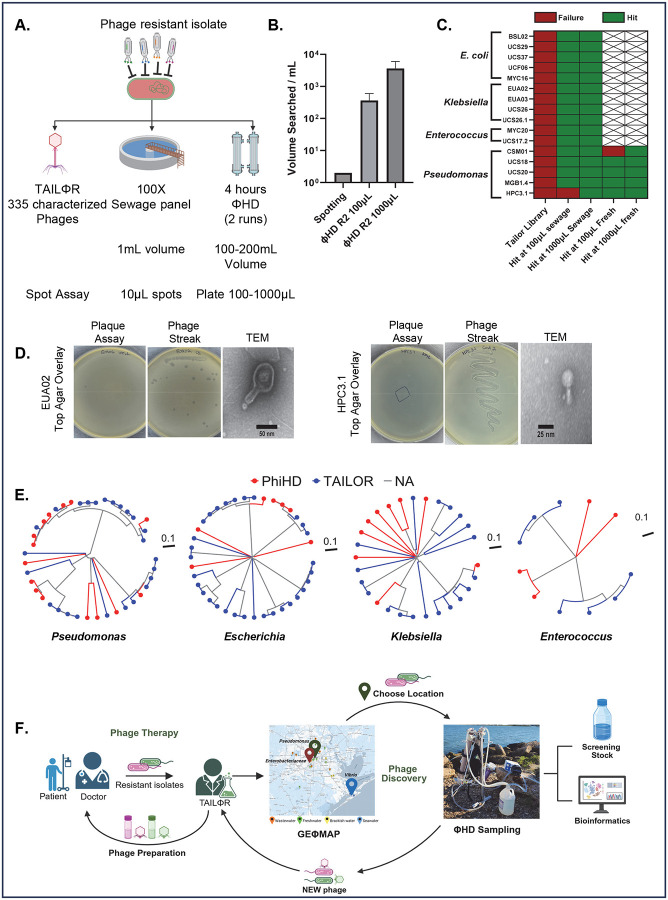
The rise of antibiotic resistance has renewed interest in bacteriophages as therapeutic alternatives. However, co-evolution of phage and bacteria will naturally give rise to phage-resistant pathogens, complicating phage therapy efforts. A critical bottleneck in the production of phage therapeutics is the discovery of virulent phages against resistant pathogens. Conventional methods for discovery are time-consuming, biased, and laborious, limiting the potential for identifying suitable phage candidates. To overcome these limitations, we combined small-volume environmental sampling with 16S rRNA sequencing to identify reservoirs where bacterial hosts co-exist with their phage predators. This strategy, which we term geographical phage mapping (geΦmapping), pinpoints ecological "hotspots" for targeted phage hunting. We further developed a portable phage hunting device (ΦHD) that generates highly enriched phage concentrates directly from these reservoirs. By integrating geΦmapping with high-throughput enrichment, we constructed the RΦ library, a diverse collection of novel phages targeting resistant pathogens.


Conflict of interest statement

Disclosure Baylor College of Medicine has filed for intellectual property protection on behalf of authors CD, PN, and AM on material related to the device in this manuscript. Remaining authors declare no competing interests.

Figures

Figure 1:
Figure 1:. Overview and schematic of ΦHD.
A) Pie charts of patient isolate status and percentage of bacterial strain with no phages for in TAILΦR’s library. Unfortunately, 24% of isolates that TAILΦR receives have no phages; at 35%, most of the isolates are Pseudomonas aeruginosa. B) Diagram from phage request to phage discovery and limitation. Clinicians and their patients can seek phage therapy for antibiotic-resistant infections when there are no other approved treatments available. After approval, clinicians send patient isolates to TAILΦR. TAILΦR’s phage library and wastewater concentrates are screened against the patient isolate. If phages are discovered, they are moved onto the next stage for preparation where phages are ultimately purified and tested for safety and efficacy before being handed to the clinician. When there are no phages for that isolate in the library, TAILΦR searches for phages through environmental sampling. Alternatively, they can train related phages to infect the isolate through directed phage evolution. C) Strategies employed in our study: Geographical Phage (Φ) mapping (GeΦmapping), Phage hunting device (ΦHD) sampling, Phage Metagenomics (ΦMICS), resistant phage (Φ) library (RΦ-Library). D) Schematic of ΦHD
Figure 2:
Figure 2:. GEΦMAPPING highlights Bray’s Bayou as a Pseudomonas rich target site, and performance of ΦHD sampling of several environmental sites.
A) Geographical map of freshwater samples obtained in Houston, TX, USA. B) Principal Coordinate Analysis (PCoA) analysis showing β-diversity differences between sewage, sea, and freshwater sources. The black arrow indicates the Vince Bayou sample. C) PCoA analysis of environmental water bodies with Bray’s Bayou target sites highlighted (purple). D) Heat map with z-score normalized by site shows distinct patterns of microbial prevalence at various sites. E) Heat map, z-score normalized by pathogen, highlights the potential of Bray’s Bayou as a target site for Pseudomonas and enteric phages. F) Quantification of anti-Pseudomonas (left) and anti-Vibrio (right) plaques (PFU/mL) from different stages of processing (input, first stage, and second stage processing). G) Heat-map showing anti-pathogen phages (log10(PFU/mL)) from freshwater sites. We display the mean and SEM of 3 technical repeat measurements. H) Plaque assay on P. aeruginosa PAO1 of unprocessed, first stage concentrate, and second stage concentrate of a freshwater sample. I) TEM of unprocessed water from freshwater. J) Plaque assay on V. parahaemolyticus 17802 of unprocessed, first stage concentrate, and second stage concentrate seawater sample. K) TEM of unprocessed water from seawater, respectively. Representative images shown (H-K).
Figure 3:
Figure 3:. GEΦMAPPING identified Enterococcus and Enterobacteriaceae was rich at West University WWTP, and performance of ΦHD sampling in wastewater.
A) Schematic of geographical areas drained by WWTPs in Houston, TX, USA. B) β-diversity analysis shows variation in OTUs present in WWTPs by PCoA analysis (colors represent differing WWTPs). C) Heatmap analysis of pathogenic taxa highlights (black box) location of enteric pathogens (z-score normalized by taxa). D) 16S analysis further localizes pathogenic taxa to wastewater influent (z-score normalized by taxa). E) Quantitation of plaques on index strains (n=3, ** = p-value ≤0.005 by 2-way ANOVA with Tukey’s multiple comparisons correction) confirms 16S sequencing data. F) Titration of VLPs from different WWTP processing areas on PAO1 (P. aeruginosa) and K-12 (E. coli) index strains (representative data shown). G) Outline of prefiltration and sedimentation step for wastewater sites. H) Quantification of anti-Pseudomonas plaques and anti-Escherichia plaques from different stages of processing show phage retention through the system and concentration of the end products. I) Titration of VLPs from different WWTP processing areas on PAO1 (P. aeruginosa). J) TEM of unprocessed ΦHD input from wastewater. K) TEM of second stage concentrated wastewater. Representative images shown (F, I-K).
Figure 4.
Figure 4.. Taxonomic classification of viral contigs from metagenomic datasets reveal distinct viral signatures as well as biased presence of viruses of pathogenic hosts between different locations.
A) vConTACT2 gene-sharing network of 16,198 viral operational taxonomic unit (vOTUs) (≥ 5kb) from West University WWTP, Brays Bayou, Clear Creek, and Galveston. Each dot (node) represents a vOTU, and each line (edge) represents the similarity between each genome. Additionally, 3,508 reference genomes from the Prokaryotic Viral RefSeq v201 database are shown in grey. B) Pie-chart of viral cluster status of vOTUs from vCONTact2. C) Pie-chart of classified (family-level) vs unclassified vOTU from PhaGCN. D) Bar graph of family-level classification (PhaGCN counts) of topmost abundant genera across the samples. Remaining genera are grouped together as “others” in grey. Unclassified vOTUs are in black. E) Heat map with z-score normalized by viral taxa to show distinct viral signatures between sites (pheatmap separated each cluster). F) Venn-diagram of shared vOTUs (cluster mode: amino-acid identity (AAI) 45%, protein coverage (PC) 80%) depict number of unique vOTUs present at each site and shared between sites. G) Heat map with z-score normalized by host reveal the relevance of sampling specific sites for phage hunting.
Figure 5.
Figure 5.. Relevance of multi-site sampling for increased diversity and collection of unique Pseudomonas and Escherichia phages.
A) Phylogenetic tree of all vOTUs predicted to have Pseudomonas host from West University WWTP wastewater and Brays Bayou freshwater metagenomic dataset. Branch-length is non-scaled. B) Venn-diagram of vOTUs-grouping (cluster mode: AAI 45%, 15 shared protein (SP), PC 80%) show no common vOTUs shared between sites. C) Phylogenetic tree of all vOTUs predicted to have Escherichia host from wastewater and Brays Bayou metagenomic dataset. Branch-length is non-scaled. D) Venn-diagram of vOTUs-grouping (cluster mode: AAI 45%, 15 shared protein (SP), PC 80%) show no common vOTUs shared between sites. Bar graphs (A, B) represents the genomic similarities between a contig and its closest neighbor based on genome-wide sequence similarities computed by tBLASTx from VipTree.
Figure 6:
Figure 6:. ΦHD increases search volumes and allowed efficient discovery of phages for phage-resistant bacterial pathogens.
A) Schematic of ΦHD compared to standard identification and discovery of therapeutic phages, B) Effective volumes that can be searched comparing standard spotting of concentrates with high-concentration, high volume ΦHD retentates (n=2 retentates with differing final concentrations), C) Heat map showing success/failure of ΦHD compared to the TAILΦR library in finding therapeutic phage candidates. D) Plaque assays (left column) on phage-resistant strains EUA02 (K. pneumoniae) and HPC3.1 (P. aeruginosa). Individual plaques (middle columns) were streaked and isolated from plaque assays. TEM images (right columns) of select isolated phages infecting EUA02 and HPC3.1. Representative images shown. E) Dendrograms of all isolated phages for Pseudomonas, Escherichia, Klebsiella, Enterococcus. Phages from ΦHD are in red, and phages from the TAILΦR library in blue. F) Diagram of the implementation of ΦHD and geΦmapping to the phage discovery pipeline

References

Manuscript References

    1. Naghavi M. et al. Global burden of bacterial antimicrobial resistance 1990–2021: a systematic analysis with forecasts to 2050. The Lancet 404, 1199–1226 (2024). 10.1016/S0140-6736(24)01867-1 - DOI
    1. Pirnay J.-P. et al. Personalized bacteriophage therapy outcomes for 100 consecutive cases: a multicentre, multinational, retrospective observational study. Nature Microbiology 9, 1434–1453 (2024). 10.1038/s41564-024-01705-x - DOI
    1. Green S. I. et al. A Retrospective, Observational Study of 12 Cases of Expanded-Access Customized Phage Therapy: Production, Characteristics, and Clinical Outcomes. Clinical Infectious Diseases 77, 1079–1091 (2023). 10.1093/cid/ciad335 - DOI - PMC - PubMed
    1. Hutinet G. et al. 7-Deazaguanine modifications protect phage DNA from host restriction systems. Nature Communications 10, 5442 (2019). 10.1038/s41467-019-13384-y - DOI
    1. Katz M. A. et al. Diverse viral cas genes antagonize CRISPR immunity. Nature 634, 677–683 (2024). 10.1038/s41586-024-07923-x - DOI - PMC - PubMed

Methods References*

    1. Apprill A., McNally S. P., Parsons R. J. & Weber L.
    1. Parada A. E., Needham D. M. & Fuhrman J. A. Every base matters: assessing small subunit rRNA primers for marine microbiomes with mock communities, time series and global field samples. Environ Microbiol 18, 1403–1414 (2016). 10.1111/1462-2920.13023 - DOI - PubMed
    1. Schloss P. D. et al. Introducing mothur: open-source, platform-independent, community-supported software for describing and comparing microbial communities. Appl Environ Microbiol 75, 7537–7541 (2009). 10.1128/AEM.01541-09 - DOI - PMC - PubMed
    1. Kozich J. J., Westcott S. L., Baxter N. T., Highlander S. K. & Schloss P. D. Development of a dual-index sequencing strategy and curation pipeline for analyzing amplicon sequence data on the MiSeq Illumina sequencing platform. Appl Environ Microbiol 79, 5112–5120 (2013). 10.1128/AEM.01043-13 - DOI - PMC - PubMed
    1. Yilmaz P. et al. The SILVA and “All-species Living Tree Project (LTP)” taxonomic frameworks. Nucleic Acids Research 42, D643–D648 %@ 0305–1048 (2013). 10.1093/nar/gkt1209 - DOI - PMC - PubMed

Publication types

LinkOut - more resources