[Preprint]. 2025 Oct 1:2025.09.29.679325.
doi: 10.1101/2025.09.29.679325.

Cancer cells surviving cisplatin chemotherapy increase stress-induced OMA1 activity and mitochondrial fragmentation

Affiliations

Cancer cells surviving cisplatin chemotherapy increase stress-induced OMA1 activity and mitochondrial fragmentation

Melvin Li et al. bioRxiv. .

Abstract

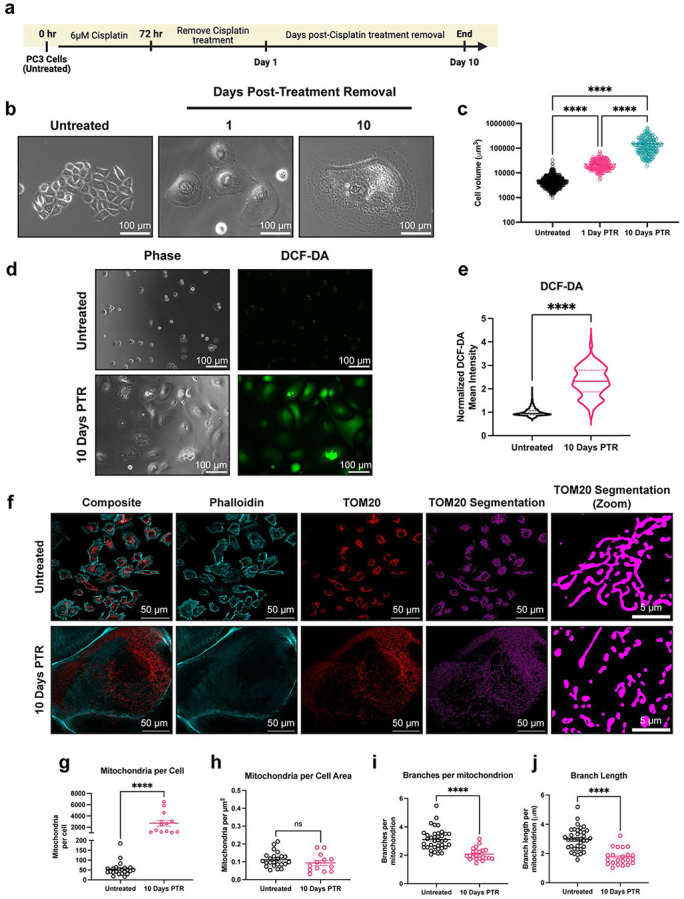
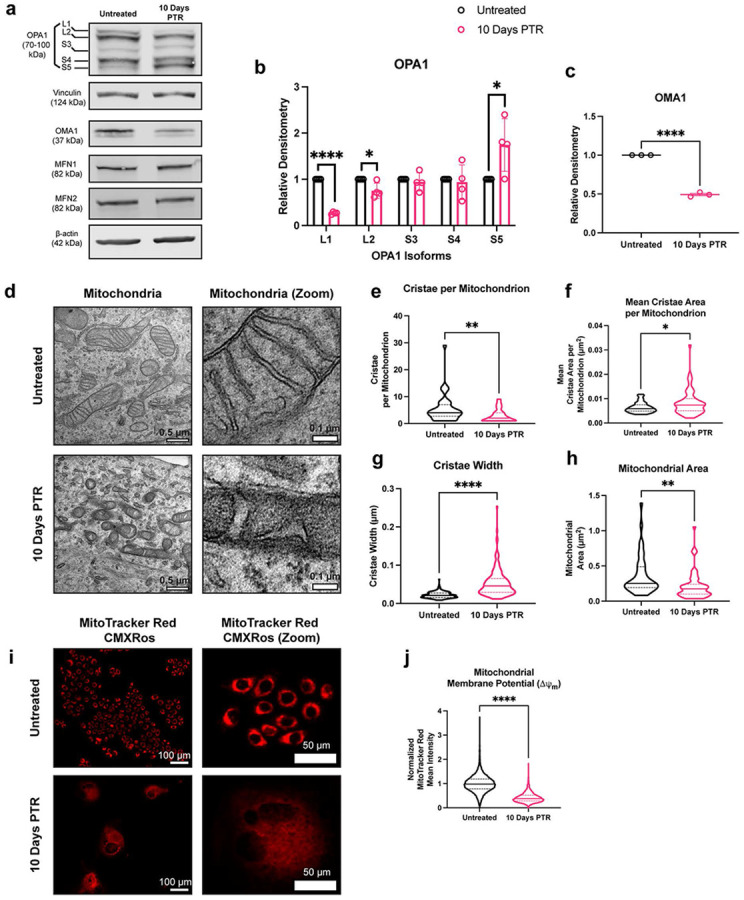
Cancer is one of the leading causes of deaths worldwide. Once cancer acquires therapy resistance, it becomes the main driver of cancer lethality in patients. Thus, mechanisms of therapy resistance must be investigated to improve patient outcomes. Mitochondria are critical organelles in the cellular stress responses, undergoing dynamic morphological and functional changes in response to external stimuli. We and others have identified a chemotherapy-resistant cancer cell state where cells that survive treatment exhibit a dramatic increase in cell size and remain non-proliferative for weeks. In this study, we demonstrate that cancer cells that enter this resistant cell state in response to cisplatin increase OMA1 activity and decrease mitochondrial fusion and function to combat oxidative stress. These findings contribute to further understanding the role of the mitochondrial stress responses in therapy resistance in cancer and provide a potential therapeutic avenue to targeting cancer cells that enter this chemotherapy-resistant cell state.

Keywords: OMA1; OPA1; cancer; mitochondrial dynamics; mitochondrial morphology; oxidative stress.


Figures

Figure 1.
Figure 1.. Cancer cells surviving chemotherapy have increased levels of reactive oxygen species and exhibit mitochondrial fragmentation.
(a) Timeline for the induction of the chemotherapy-resistant cancer cell state. Created in BioRender. Li, M. (2025) https://BioRender.com/vkhgx05 (b) Phase contrast images of untreated cells and cells 1- and 10-Days Post-Treatment Removal (PTR). (c) Cell volume measurements of untreated cells and cells 1- and 10-Days PTR. (d) Phase contrast images and DCF-DA fluorescence images in untreated cells and cells 10 Days PTR. (e) Quantification of mean fluorescence intensity of DCF-DA staining. (f) Representative images of TOM20 and Phalloidin in untreated cells and cells 10 Days PTR. Segmentation of TOM20 signal was performed to quantify mitochondrial morphology features. (g) Quantification of number of mitochondria per cell. (h) Quantification of mitochondria normalized to cell area. (i) Quantification of number of branches per mitochondrion. (j) Quantification of branch length per mitochondrion. n = 679, 257, and 249 cells for untreated, cells 1 Day PTR, and cells 10 Days PTR, respectively (c); n = 1141 and 362 cells for untreated and cells 10 Days PTR, respectively (e); n = 37 and 22 cells for untreated and cells 10 Days PTR, respectively (g-j). Data are presented as mean ± s.e.m. (c, g-j), while data in violin plots were presented as median and corresponding interquartile ranges (e). p values were calculated with a one-way ANOVA followed by a post-hoc Tukey’s multiple comparisons test (c), a two-tailed Mann Whitney test (e), and an unpaired Student’s two-tailed t-test (g-j). ns not significant, **** p<0.0001.
Figure 2.
Figure 2.. Cells 10 Days PTR increase DRP1 localization to mitochondria.
(a) Representative western blots of Phospho-DRP1 Ser637, Phospho-DRP1 Ser616, DRP1, MFF, MiD49, MiD51, and β-actin loading control. n = 3 biological replicates. We note that due to similarities in molecular weight and identical primary antibody species, each protein was probed independently on separate blots with their own separate β-actin loading control. Original, uncropped blots (including the β-actin loading control for each blot) are presented in Supplementary Figure S2. (b) Max intensity projection images of TOM20 and DRP1 channels in untreated cells and cells 10 Days PTR. (c) Normalized profile intensity plot of TOM20 and DRP1 signal in untreated cells. (d) Normalized profile intensity plot of TOM20 and DRP1 signal in cells 10 Days PTR. (e) 3-dimensional (3D) rendering of TOM20, DRP1, and Phalloidin signal in untreated cells and cells 10 Days PTR. (f) Quantification of TOM20-DRP1 colocalization in 3D. n = 11 cells each for untreated and cells 10 Days PTR (f). Data are presented as mean ± s.e.m. in (f), and p values were calculated with an unpaired Student’s two-tailed t-test (f). ** p<0.01.
Figure 3.
Figure 3.. Mitochondria in cells 10 Days PTR have aberrant cristae morphology.
(a) Representative western blots of OPA1, OMA1, Vinculin, and β-actin loading control. We note that due to similarities in molecular weight and identical primary antibody species, each protein was probed independently on separate blots with their own separate β-actin or vinculin loading control. Original, uncropped blots (including the β-actin or vinculin loading control for each blot) are presented in Supplementary Figure S3. b) Quantifications of OPA1 isoform protein expression in untreated cells and cells 10 Days PTR. Samples derive from the same experiment in each blot that was quantified. (c) Quantification of OMA1 expression in untreated cells and cells 10 Days PTR. Samples derive from the same experiment in each blot that was quantified. (d) Representative transmission electron microscopy (TEM) images of mitochondria in untreated cells and cells 10 Days PTR. (e) Quantification of number of cristae per mitochondrion. (f) Quantification of mean cristae area per mitochondrion. (g) Quantification of cristae width. (h) Quantification of mitochondrial area between untreated cells and cells 10 Days PTR. (i) Representative fluorescence images of MitoTracker Red CMXRos staining in untreated cells and cells 10 Days PTR. (j) Quantification of mean fluorescence intensity of MitoTracker Red CMXRos staining between indicated groups. n = 4 biological replicates (b); n = 3 biological replicates (c); n = 42 and 59 mitochondria for untreated and cells 10 Days PTR, respectively (e-f, h); n = 229 and 177 cristae for untreated and cells 10 Days PTR, respectively (g); n = 12,147 and 2502 cells for untreated and cells 10 Days PTR, respectively (j). Data are presented as mean ± s.e.m. (b-c), while data in violin plots are presented as median and corresponding interquartile ranges (e-h, j). p values were calculated with a two-tailed Kolmogorov-Smirnov test (e-h), and a two-tailed Mann-Whitney test (j). * p<0.05, ** p<0.01, **** p<0.0001.
Figure 4.
Figure 4.. Cells 10 Days PTR decrease both mitochondrial fission and fusion dynamics.
(a) Representative fluorescence images of mitochondria every 60 seconds for 6 minutes in untreated cells and cells 10 Days PTR. Yellow arrow and box indicate a fusion event, while a blue arrow and box indicate a fission event. (b) Linear regression analysis of fission rate vs mitochondrial area. (c) Linear regression analysis of fusion rate vs mitochondrial area. (d) Quantification of fission rate in untreated cells and cells 10 Days PTR when normalized to mitochondrial area. (e) Quantification of fusion rate in untreated cells and cells 10 Days PTR when normalized to mitochondrial area. n = 37 and 17 cells for untreated and cells 10 Days PTR, respectively (b-c, d-e). Data are presented as scatter plots (b-c) and mean ± s.e.m. (d-e). R-squared values were calculated with the lm() and summary() functions in RStudio (b-c). p values were calculated with the lm() and summary() functions in RStudio (b-c) and a two-tailed Mann-Whitney test (d-e). * p<0.05, ** p<0.01.
Figure 5.
Figure 5.. Cancer cells surviving chemotherapy increase OMA1 activity and decrease mitochondrial fusion and function to combat oxidative stress.
Cancer cells that survive chemotherapy enter a resistant cell state that increases their cell size and remain non-proliferative. Cells in this state have increased levels of reactive oxygen species (ROS) and exhibit fragmented mitochondria. Cells in this state increase OMA1 activity, cleaving L-OPA1 to S-OPA1, ultimately disrupting the mitochondrial cristae structure and reducing mitochondrial fusion. This altered cristae structure generates a diffuse proton gradient and decreases mitochondrial membrane potential, which lowers oxidative capacity and endogenous ROS production as a survival mechanism against oxidative stress in these cells. Created in BioRender. Li, M. (2025) https://BioRender.com/41jh49x.

References

    1. Giacomello M., Pyakurel A., Glytsou C. & Scorrano L. A.-O. The cell biology of mitochondrial membrane dynamics.
    1. Wai T. Is mitochondrial morphology important for cellular physiology? LID - S1043-2760(24)00123-1 [pii] LID - 10.1016/j.tem.2024.05.005 [doi]. - DOI
    1. Jin P. et al. Mitochondrial adaptation in cancer drug resistance: prevalence, mechanisms, and management. Journal of Hematology & Oncology 15, 97 (2022). 10.1186/s13045-022-01313-4 - DOI - PMC - PubMed
    1. Huang Q. et al. Increased mitochondrial fission promotes autophagy and hepatocellular carcinoma cell survival through the ROS-modulated coordinated regulation of the NFKB and TP53 pathways.
    1. Tomková V., Sandoval-Acuña C., Torrealba N. & Truksa J. Mitochondrial fragmentation, elevated mitochondrial superoxide and respiratory supercomplexes disassembly is connected with the tamoxifen-resistant phenotype of breast cancer cells. Free Radical Biology and Medicine 143, 510–521 (2019). 10.1016/j.freeradbiomed.2019.09.004 - DOI - PubMed

Publication types

LinkOut - more resources