[Preprint]. 2025 Oct 1:2025.09.29.679307.
doi: 10.1101/2025.09.29.679307.

Retrograde mitochondrial transport regulates mitochondrial biogenesis in zebrafish neurons

Affiliations

Retrograde mitochondrial transport regulates mitochondrial biogenesis in zebrafish neurons

Angelica E Lang et al. bioRxiv. .

Abstract

To maintain a healthy mitochondrial population in a long-lived cell like a neuron, mitochondria must be continuously replenished through the process of mitochondrial biogenesis. Because the majority of mitochondrial proteins are nuclear encoded, mitochondrial biogenesis requires nuclear sensing of mitochondrial population health and function. This can be a challenge in a large, compartmentalized cell like a neuron in which a large portion of the mitochondrial population is in neuronal compartments far from the nucleus. Using in vivo assessments of mitochondrial biogenesis in zebrafish neurons, we determined that mitochondrial transport between distal axonal compartments and the cell body is required for sustained mitochondrial biogenesis. Estrogen-related receptor transcriptional activation links transport with mitochondrial gene expression. Together, our data support a role for retrograde feedback between axonal mitochondria and the nucleus for regulation of mitochondrial biogenesis in neurons.


Conflict of interest statement

Competing interests: The authors declare no competing interests.

Figures

Figure 1:
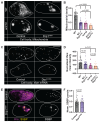
Figure 1:. Mitochondrial cell body density and biogenesis markers are reduced in actr10 mutants.
(A) 4 dpf zebrafish transgenic larva carrying the TgBAC(neurod:egfp)nl1 transgene which labels neurons with GFP. The posterior lateral line gangion (pLLg) and a pLL axon terminal are boxed and magnified. (B) 4 dpf pLLg cell body and pLL axon terminal expressing cytosolic GFP and mitochondria-localized TagRFP (MitoTagRFP, magenta) in wild type and actr10 mutants. (C) Quantification of mitochondrial density (mitochondrial area/cytosolic area; ANOVAs). (D,E) SSBP and TFAM immunostaining in pLL cell body mitochondria, visualized with mitochondria-localized GFP (Mito, magenta). (F,G) Number of SSBP or TFAM puncta normalized to mitochondrial volume (Wilcoxon). (H) HCR RNA FISH labeling of pgc1a and tfam mRNA in the pLLg of wild type and actr10 mutants carrying the TgBAC(neurod:egfp)nl1 transgene (white outline). (I) pLLg mean fluorescence intensity of pgc1a and tfam normalized to background (ANOVAs) in wild type, actr10, nudc, p150, and wild type/actr10 larvae expressing Actr10 in neurons (+ rescue). Scale bars: (A) full larva = 200 μm, insets = 10 μm; (B, D, & E) = 5 μm; (H) = 10 μm. All data are mean ± SEM and points represent individual larvae.
Figure 2:
Figure 2:. Mitochondrial gene expression is downregulated in actr10 mutants.
(A) RNA-sequencing strategy. (B) Volcano plot showing differential gene expression between wild type and actr10 mutants. The plot shows −log10(adjusted p-value) vs. log2(Fold Change). Blue dots represent genes significantly downregulated while red dots represent genes significantly upregulated in actr10 mutants. Genes selected for secondary analysis using HCR RNA FISH are labeled. (C) Overlap between downregulated genes and the MitoCarta3.0 database of the mitochondrial proteome (Fisher’s exact test). Human homologs of downregulated zebrafish genes were used for analysis. Duplicated zebrafish paralogues were only counted once. (D) GSEA plot for Mitochondrial Protein Complexes, the most significantly de-enriched gene ontology term in actr10 mutants relative to wild type. (E) Representative images of HCR RNA FISH labeling of cox5ab mRNA in the pLLg (outlined in white) for wild type, actr10, nudc, and p150 mutants. Scale bar = 10 μm. (F) pLLg mean fluorescence intensity of cox5ab normalized to background (ANOVAs). (G) pLLg mean fluorescence intensity normalized to background for downregulated mitochondrial genes in wild type vs. actr10 mutants (ANOVAs). (H) pLLg mean fluorescence intensity normalized to background for control genes in wild type vs. actr10 mutants (ANOVAs). (F-H) Data plot lines represent the median and quartiles; data points represent individual larvae.
Figure 3:
Figure 3:. Cell body-derived mitochondrial density in the axon terminal is reduced in actr10 mutants.
(A) Photoconversion strategy. Mitochondrial matrix-localize mEos in the pLLg was locally converted using 405 nm laser. An axon terminal in the mid-trunk (neuromast 3 - NM3) was imaged 4 hpc (B) or every minute for 6h (D). (B) NM3 4 hpc in wild type, actr10, and transgenic overexpressing (OE) PGC-1α in neurons (Tg(−5kbneurod1:PGC1α-2A-mRFP)uwd9). (C) Mean fluorescence intensity of cell body-derived mitochondria (Converted) in the axon terminal population (Steel-Dwass). (D) Representative timepoint of a pLL axon terminal from 6 hr timelapse video (Movies S5 and S6). Cell body-derived mitochondria indicated with white arrowheads. (E,F) Quantification of the number (E, ANOVA) and size (F, Wilcoxon) of converted mitochondria entering the axon terminal. Scale bars = 5 μm. All data are mean ± SEM. Data points represent individual larvae in C and E and individual mitochondria measured from 4 wild type and 3 actr10 axon terminals in F.
Figure 4:
Figure 4:. Disrupting mitochondrial fission does not alter tfam expression or mtDNA replication.
(A) Single pLL cell bodies (white outline) expressing mitoTagRFP in wild type and actr10 mutant larvae expressing Drp1K38A-RFP or RFP (control). (B) Quantification of mitochondrial density (Steel-Dwass). (C) HCR RNA FISH labeling of tfam mRNA in a pLL cell body (white outline). (D) Mean fluorescence intensity of tfam (Steel-Dwass). (E) SSBP immunostaining in pLL cell body mitochondria, visualized with mitochondria-localized GFP (Mito, magenta). (F) Number of SSBP puncta normalized to mitochondrial volume (ANOVA). All data are mean ± SEM. Data points represent individual larvae.
Figure 5:
Figure 5:. MitoTruck expression decreases cell body mitochondrial density and markers of mitochondrial biogenesis.
(A) Schematic of the MitoTruck construct. The constitutively active KIF1A motor domain was tethered to mitochondria with the OMP25 outer mitochondrial membrane localization signal (MLS) and visualized with GFP. (B, C) pLL axon (B) and cell body (C) expressing MitoTruck (green) and MitoTagRFP (Mito, magenta). (D) Quantification of pLL cell body mitochondrial density (Wilcoxon). (E) Representative images of HCR RNA FISH labeling of tfam mRNA in a single pLL cell body (white outline) without and with MitoTruck expression. (F) Mean fluorescence intensity of tfam normalized to background (ANOVA). (G) SSBP immunostaining in a single pLL cell body. Mitochondria visualized with mitochondrially localized TagRFP (Mito, magenta). (H) Number of SSBP puncta normalized to mitochondrial volume (ANOVA). Scale bars = 5 μm. All data are mean ± SEM and points represent individual larvae.
Figure 6:
Figure 6:. ERR activity links mitochondrial transport and mitochondrial biogenesis.
(A) Transcription factor enrichment analysis for genes significantly downregulated in actr10 mutants. Plot shows log2(Odds Ratio) vs. log10(adjusted p-value). Top 10 enriched genes based on euclidean distance from log2(OR)/log10(adj. p-value) to the origin are labeled. Box indicates ERR transcription factors identified in the dataset. (B) Overlap between downregulated genes and ESRRG neuronal ChIP-seq targets (Fisher’s exact test). Human homologs of downregulated zebrafish genes were used for transcription factor analyses. Duplicated zebrafish paralogues were only counted once in the analysis. (C) HCR RNA FISH labeling of tfam mRNA in a pLL cell body (white outline) over-expressing (OE) Esrra and an adjacent control cell body in the same pLLg (WT). (D) Mean fluorescence intensity of tfam (paired t-test). (E) HCR RNA FISH labeling of tfam in a single pLL cell body (white outline) of a wild type and actr10 larva overexpressing Esrra. (F) Mean fluorescence intensity of tfam normalized to background (ANOVA). (G) Mitochondria labeled by MitoTagRFP or Mito-eGFP in wild type and actr10 axon terminals with and without Esrra overexpression. (H) Quantification of mitochondrial density (Steel-Dwass). (D, F, H,) Data points represent individual larvae; data are mean ± SEM. Scale bars = 5 μm.
Figure 7:
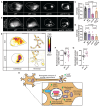
Figure 7:. Activation of Sirt1 rescues cell body mitochondrial density.
(A, B) Mitochondria in wild type and actr10 pLL cell bodies with and without resveratrol (+ res.; A) or AICAR (+AICAR; B) treatment. (C,D) Quantification of mitochondrial density (ANOVAs; Tukey HSD). (E-G) Cell body and axon terminal mitochondrial NAD+ levels are altered in actr10 mutants (cell body: Wilcoxon; axon terminal: ANOVA). Inverted heat map indicates levels of mitochondrial NAD+. Outline surrounds single pLL cell body and axon terminal. (H) Model of mitochondrial retrograde transport regulation of mitochondrial biogenesis. Data are mean ± SEM. Data points represent individual larvae. Scale bars = 5 μm.

References

    1. Suomalainen A., and Nunnari J. (2024). Mitochondria at the crossroads of health and disease. Cell 187, 2601–2627. 10.1016/j.cell.2024.04.037. - DOI - PubMed
    1. Misgeld T., and Schwarz T.L. (2017). Mitostasis in Neurons: Maintaining Mitochondria in an Extended Cellular Architecture. Neuron 96, 651–666. 10.1016/j.neuron.2017.09.055. - DOI - PMC - PubMed
    1. Gerhart-Hines Z., Rodgers J.T., Bare O., Lerin C., Kim S.-H., Mostoslavsky R., Alt F.W., Wu Z., and Puigserver P. (2007). Metabolic control of muscle mitochondrial function and fatty acid oxidation through SIRT1/PGC-1α. The EMBO Journal 26, 1913–1923. 10.1038/sj.emboj.7601633. - DOI - PMC - PubMed
    1. Jäger S., Handschin C., St.-Pierre J., and Spiegelman B.M. (2007). AMP-activated protein kinase (AMPK) action in skeletal muscle via direct phosphorylation of PGC-1α. Proceedings of the National Academy of Sciences 104, 12017–12022. 10.1073/pnas.0705070104. - DOI
    1. Ojuka E.O., Jones T.E., Han D.H., Chen M., and Holloszy J.O. (2003). Raising Ca 2+ in L6 myotubes mimics effects of exercise on mitochondrial biogenesis in muscle. The FASEB Journal 17, 675–681. 10.1096/fj.02-0951com. - DOI - PubMed

Publication types

LinkOut - more resources