[Preprint]. 2025 Sep 29:2025.09.26.678671.
doi: 10.1101/2025.09.26.678671.

Genome-wide screen in Mycobacterium tuberculosis infected macrophages reveals innate regulation of antibacterial mediators by IRF2

Affiliations

Genome-wide screen in Mycobacterium tuberculosis infected macrophages reveals innate regulation of antibacterial mediators by IRF2

Allison W Roberts et al. bioRxiv. .

Abstract

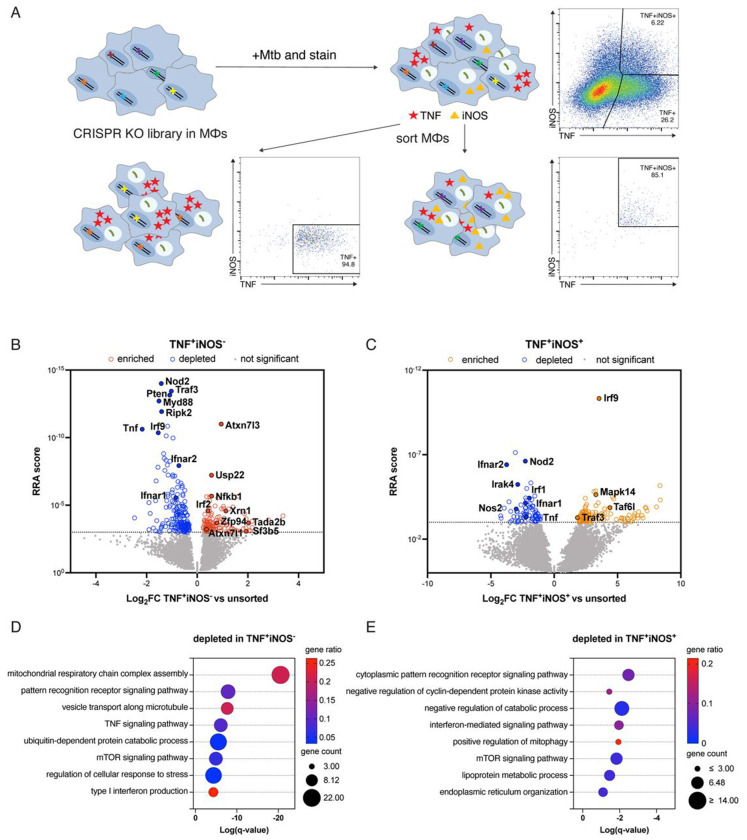
Controlling Mycobacterium tuberculosis (Mtb) infection requires a precisely balanced host inflammatory response. Too little inflammation leads to uncontrolled bacterial growth but exacerbated inflammation, activated by mediators such as TNF and type I IFN, inhibits effective antibacterial responses. How these immunopathological states are established is unknown. Deeper understanding of the pathways elicited upon initial Mtb infection of the host macrophage may reveal vital regulatory mechanisms that govern the subsequent inflammatory environment and ultimate resolution of infection. To elucidate these early regulators of inflammation, we performed a genome-wide CRISPR knockout screen in macrophages to identify genes that influence the induction of TNF and iNOS upon infection with Mtb. The resulting dataset is a valuable resource that includes genes representing a wide range of unexpected regulatory mechanisms that control cytokine responses to Mtb and also cell-intrinsic resistance to infection by the bacterial pathogen Listeria monocytogenes. We show that type I IFN signaling enhances TNF production early after infection, and IRF2 acts to inhibit induction of the antibacterial state of macrophages. Our data support a model in which early production of type I IFN in response to bacterial infection serves to increase innate antibacterial resistance during the earliest stages of infection.


Figures

Figure 1:
Figure 1:
Genome-wide CRISPR knockout screen identifies regulators of TNF and iNOS in response to Mycobacterium tuberculosis infection of macrophages. (A) Schematic of screen. A genome-wide knockout library in CIMs was sorted based on TNF and iNOS expression during infection with Mtb. TNF and iNOS protein levels were analyzed by flow cytometry 24 hrs post infection and TNF+iNOS and TNF+iNOS+ CIMs were sorted as shown. (B and C) Results of genes depleted or enriched in (B) TNF+iNOS or (C) TNF+iNOS+ sorted macrophages compared to unsorted macrophages. (D and E) Gene set enrichment analysis of genes depleted in TNF+iNOS (D) or TNF+iNOS+ (E) macrophage populations. Data are the combined results of two independent experiments.
Figure 2:
Figure 2:
Arrayed secondary screen identifies regulators of cytokine and nitric oxide induction during Mycobacterium tuberculosis infection of macrophages. CIMs lacking candidate genes were generated using two independent sgRNA for each candidate, and infected with fluorescent Mtb. (A) Four days post infection Mtb growth in macrophages was analyzed by quantifying fluorescent area in KO macrophages normalized to fluorescent area in control (scramble gRNA) macrophages. (B-D) Two days post infection levels of (B) TNF, (C) nitric oxide, and (D) IFNβ were measured and normalized to levels generated by control macrophages. Graphs show compiled data from four experiments, each examining different guides and the corresponding controls. Data for each guide show the mean +/− SD from one experiment with four replicates. A second independent experiment confirmed the results for Ifnar1, Atxn7l3, Irf2, and Traf3. Data were statistically analyzed using t-test with Holm-Sidak’s multiple comparisons test. P < 0.05, **P < 0.01, ***P < 0.001, **** P < 0.0001.
Figure 3:
Figure 3:
Arrayed secondary screen identifies regulators of bacterial growth and cytokine responses during Listeria monocytogenes infection of macrophages. CIMs lacking candidate genes were generated using two independent sgRNA for each candidate, and infected with fluorescent Lm. (A) Five hours post infection Lm growth in macrophages was analyzed by quantifying fluorescent area in KO macrophages normalized to fluorescent area in control (scramble gRNA) macrophages. (B-C) Cell supernatants were measured for levels of (B) TNF and (C) IFNβ and normalized to levels generated by control macrophages. Graphs show compiled data from four experiments, each examining different guides and the corresponding controls. Data for each guide show the mean +/− SD from one experiment with four replicates. A second independent experiment confirmed the results for Ifnar1, Pten, Atxn7l3, Irf2, Traf3, and Mapk14. Data were statistically analyzed using t-test with Holm-Sidak’s multiple comparisons test. *P < 0.05, **P < 0.01, ***P < 0.001, **** P < 0.0001.
Figure 4:
Figure 4:
IRF2 inhibits TNF production in response to PRR stimulation. (A) TNF and (B) nitric oxide production by WT and IFNAR KO BMMs stimulated with CpG or Pam3CSK4 +/− IFNβ or IFNγ. Data are representative of at least two independent experiments. (C) TNF and (D) Nitric oxide production by double knockout CIMs (transduced with guides for Irf2 or scramble and Irf9, Ifnar1, or scramble) stimulated with LPS or Pam3CSK4 +/− IFNβ or IFNγ. Data are representative of at least three independent experiments. (E) TNF and (F) nitric oxide production by WT and Irf2 KO BMMs stimulated with LPS or Pam3CSK4 +/− IFNβ or IFNγ. Data are representative of at least three independent experiments. (G) TNF and (H) nitric oxide production by double knockout CIMs prestimulated +/− IFNβ for 24 hours before stimulation with Pam3CSK4 +/− IFNβ. Data are representative of at least three independent experiments. All data are presented as mean +/− SD and were statistically analyzed using two-way ANOVA with Sidak’s multiple comparisons test. *P < 0.05, **P < 0.01, ***P < 0.001, **** P < 0.0001.
Figure 5:
Figure 5:
IRF2 inhibits proliferation during macrophage differentiation. (A) 2x10⁶ double knockout CIM progenitors (transduced with guides for Irf2 or scramble and Irf9, Ifnar1, or scramble) were differentiated for seven days and cell numbers were quantified. Data are the combined results of at least three independent experiments. Data are presented as mean +/− SD and were statistically analyzed using two-way ANOVA with Sidak’s multiple comparisons test. *P < 0.05, **P < 0.01, ***P < 0.001, **** P < 0.0001. (B) Genome wide CRISPR knockout screen examining macrophage differentiation and proliferation. The CIM progenitor knockout library was differentiated into macrophages, and undifferentiated cells at day 0 were compared to cells differentiated for seven days. Shown are results of genes depleted or enriched in differentiated CIMs compared to progenitors. Data are the combined results of three independent experiments.
Figure 6:
Figure 6:
Listeria monocytogenes growth is restricted in Irf2 deficient macrophages downstream of IFNAR signaling. (A-C) WT Lm intracellular CFU were enumerated at indicated time points post infection in (A) CIMs, transduced with guides for Irf2 or scramble controls, (B) control and Irf2 KO BMMs, or (C) double knockout CIMs (transduced with guides for Irf2 or scramble and Irf9 or scramble). Data are representative of at least three independent experiments. (D) Double knockout CIMs (transduced with guides for Irf2 or scramble and Ifnar1, Irf9, or scramble) were infected with TagRFP-Lm. Five hours post infection Lm growth in CIMs was analyzed by quantifying TagRFP area. Data are representative of at least three independent experiments. (E) Double knockout CIMs, (transduced with guides for Irf2 or scramble and Stat1, Stat2, or scramble) were infected with TagRFP-Lm. Lm growth was analyzed five hours post infection. Data are representative of at least two independent experiments. (F-G) Double knockout CIMs (transduced with guides for Irf2 or scramble and Ifnar1, Irf9, or scramble) were prestimulated +/− (F) IFNβ or (G) IFNγ for 18 hours before infection with TagRFP-Lm. Lm growth was analyzed five hours post infection. Data are representative of at least three independent experiments. (H) Control and Irf2 KO BMMs were prestimulated +/− IFNγ for 18 hours before infection with TagRFP-Lm. Lm growth was analyzed five hours post infection. Data are representative of at least three independent experiments. (I) Double knockout CIMs were stimulated +/− IFNγ for 20 hours before IFNβ levels were quantified. Data are representative of at least two independent experiments. All data are presented as mean +/− SD and were statistically analyzed using one-way (D) or two-way ANOVA with Sidak’s multiple comparisons test. *P < 0.05, **P < 0.01, ***P < 0.001, **** P < 0.0001.
Figure 7:
Figure 7:
IRF2 regulates expression of antimicrobial mediators. (A-D) Double knockout CIMs (transduced with guides for Irf2 or scramble and Irf9 or scramble) were infected with WT Lm. Two hours post infection total RNA was collected and used for RNAseq analysis. Data are from three independent experiments. (A) Displayed are the average log2 fold change, relative to scramble, of genes with differential expression in at least one knockout macrophage line. Genes are clustered based on fold change in different knockout macrophage lines. (B) Pathway enrichment of gene clusters. (C-D) Heat map of (C) GBP family or (D) Il21r and Il2rg gene expression in knock out macrophages relative to scramble. Shown are values from three independent experiments. (E) Double knockout CIMs (transduced with guides for Irf2 or scramble and Il21r or scramble) or (F) WT and Irf2 KO BMMs were prestimulated +/− IL-21 before infection with TagRFP-Lm. Five hours post infection Lm growth was analyzed by quantifying TagRFP area. Data are representative of two (E) or three (F) independent experiments. (G) BMMs loaded with fluorescein-dextran were infected with WT Lm or administered silicon dioxide microspheres (SMS) for two hours. Fluorescence was measured after excitation at 425nm and 488nm and used to determine the area with pH above 5.5. Data are representative of two independent experiments. All data are presented as mean +/− SD and were statistically analyzed using two-way ANOVA with Sidak’s multiple comparisons test. *P < 0.05, **P < 0.01, ***P < 0.001, **** P < 0.0001.

References

    1. Barber D.L., Mayer-Barber K.D., Feng C.G., Sharpe A.H., and Sher A.. 2011. CD4 T Cells Promote Rather than Control Tuberculosis in the Absence of PD-1–Mediated Inhibition. The Journal of Immunology. 186:1598–1607. doi: 10.4049/jimmunol.1003304. - DOI - PMC - PubMed
    1. Boneca I.G., Dussurget O., Cabanes D., Nahori M.-A., Sousa S., Lecuit M., Psylinakis E., Bouriotis V., Hugot J.-P., Giovannini M., Coyle A., Bertin J., Namane A., Rousselle J.-C., Cayet N., Prévost M.-C., Balloy V., Chignard M., Philpott D.J., Cossart P., and Girardin S.E.. 2007. A critical role for peptidoglycan N-deacetylation in Listeria evasion from the host innate immune system. Proceedings of the National Academy of Sciences. 104:997–1002. doi: 10.1073/pnas.0609672104. - DOI
    1. Braverman J., and Stanley S.A.. 2017. Nitric Oxide Modulates Macrophage Responses to Mycobacterium tuberculosis Infection through Activation of HIF-1α and Repression of NF-κB. The Journal of Immunology. 199:1805–1816. doi: 10.4049/jimmunol.1700515. - DOI - PMC - PubMed
    1. Bulua A.C., Simon A., Maddipati R., Pelletier M., Park H., Kim K.-Y., Sack M.N., Kastner D.L., and Siegel R.M.. 2011. Mitochondrial reactive oxygen species promote production of proinflammatory cytokines and are elevated in TNFR1-associated periodic syndrome (TRAPS). J Exp Med. 208:519–533. doi: 10.1084/jem.20102049. - DOI - PMC - PubMed
    1. Cantaert T., Baeten D., Tak P.P., and van Baarsen L.G.. 2010. Type I IFN and TNFα cross-regulation in immune-mediated inflammatory disease: basic concepts and clinical relevance. Arthritis Research & Therapy. 12:219. doi: 10.1186/ar3150. - DOI - PMC - PubMed

Publication types

LinkOut - more resources