[Preprint]. 2025 Oct 26:2025.10.26.683539.
doi: 10.1101/2025.10.26.683539.

Host transcriptional responses to gut microbiome variation arising from urbanism

Affiliations

Host transcriptional responses to gut microbiome variation arising from urbanism

Sabrina Arif et al. bioRxiv. .

Abstract

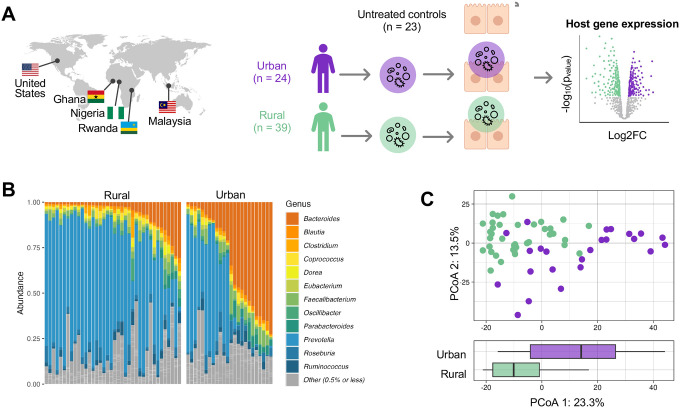
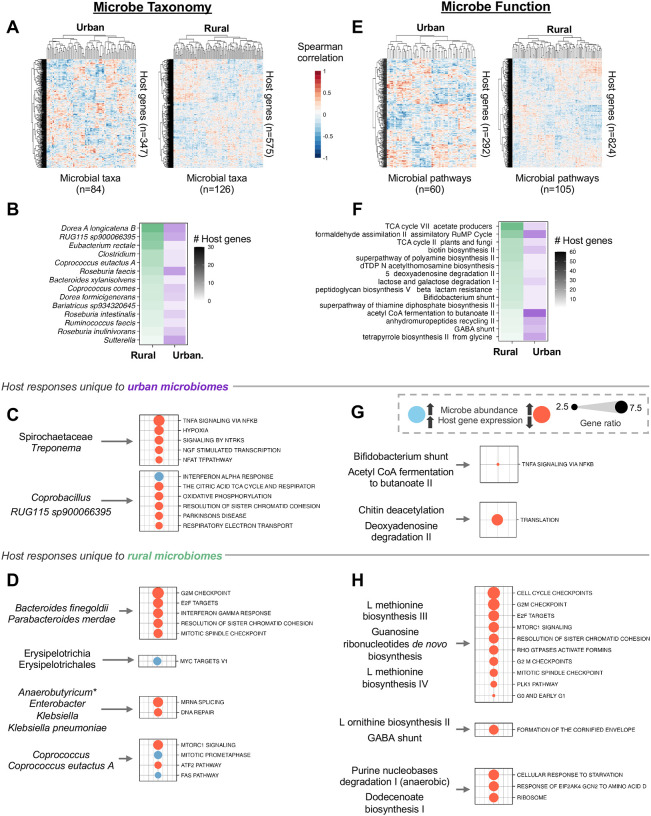
Gut microbiomes of urban communities are compositionally different from their rural counterparts, and are associated with immune dysregulation and gastrointestinal disease. However, it is unknown whether these compositional differences impact host physiology, and through what mechanisms. Here, we used human colonic epithelial cells to directly compare host transcriptional changes induced by gut microbiomes from urban versus rural communities. We co-cultured host cells with live, stool-derived gut microbiomes from Rwanda, Ghana, Nigeria, Malaysia, and the United States, and quantified transcriptional responses using RNA-seq. We found that urban microbiomes affected innate immune pathways, including TNF signaling and bacterial antigen recognition. We also found that high-diversity microbiomes elicited a stronger host transcriptional response, while low-diversity microbiomes triggered epithelial restructuring and glycolysis. Finally, specific taxa driving these effects, including Bifidobacterium adolescentis and Bacteroides dorei, correlated with lifestyle factors such as diet. These findings demonstrate that urbanization-associated microbiome changes directly influence host epithelial gene expression.


Conflict of interest statement

Competing interests The authors declare no competing interests.

Figures

FIGURE 1
FIGURE 1. Experimental model and microbiome sample set overview.
A Fecal microbiome samples of urban (n=24) and rural (n=39) communities were sampled from five countries. Colonocytes were treated (n=63; n=23 control) with the live microbiome samples (see Methods) and gene expression was measured using RNA sequencing. B The y-axis represents genus-level relative abundances for the microbiomes of 63 donors (x-axis). Taxa in color have a median abundance of 0.5% or greater while low-abundance genera are grouped together in grey (see legend). C Top: Genus-level principal coordinate analysis (PCoA) of microbiome samples. The x- and y-axes are the first and second principal components, representing 23.3% and 13.5% of variability in microbiome composition, respectively. Bottom: Box plot of PC1. Values of PC1 are shown for urban (purple) and rural (green) samples.
FIGURE 2
FIGURE 2
A–C Host transcriptional response to urban and rural microbiomes. A Differentially expressed host genes (DEGs) compared to control condition. Log2 fold change values shown for DEGs significant at FDR < 10%. Dots indicate DEGs specific to urban (purple), rural (green), or shared between both (black) microbiome conditions. B, C Enriched host gene pathways (FDR < 10%, gene count ≥ 3) in response to urban (B) and rural (C) microbiomes. Upregulated and downregulated pathways shown in bottom and top panels, respectively. Dot size reflects −log(p-value). D–G Microbiome alpha diversity associated with distinct host transcriptional responses. D Density plot of Shannon diversity values across microbiome samples. Median (3.62) indicated by black dotted line. Samples below the median (light blue) are classified as “low diversity”; those above (dark blue) as “high diversity.” Pie charts indicate the proportion of urban (purple) and rural (green) samples in each group. Rug plot shows individual sample distribution: purple and green ticks correspond to urban and rural communities, respectively. E Number of host DEGs in response to low diversity microbiomes vs. control (light blue) and high diversity microbiomes vs. control (dark blue). F Volcano plot depicting host genes that respond to low diversity vs. high diversity microbiomes. Genes significantly (FDR < 10%) upregulated in low diversity microbiomes shown in light blue, high diversity shown in dark blue, and NS shown in grey. G Enriched host gene pathways (FDR < 10%, gene count ≥ 3) in response to low (light blue) vs. high (dark blue) diversity microbiomes. Observed values (y-axis) represent the number of input genes annotated to each pathway. Expected values (x-axis) were calculated as the input list size multiplied by the proportion of background genes annotated to the pathway; 1:1 shown by black dashed line.
FIGURE 3
FIGURE 3
A-D Transcriptional response of host to microbe taxonomy. A Spearman correlation between microbial taxa (x axis) and expression levels of host genes (y axis). Value of Spearman correlation coefficient indicated by color (red=positive, white=0, blue=negative). Taxa/host gene only included if identified as significant (FDR < 10%) in lasso analysis (see Methods). Analysis applied separately to colonocytes responding to urban (left) and rural (right) microbiomes. x and y axes subjected to hierarchical clustering using the Euclidean distance metric. B. Microbes (y axis) with the greatest number of pairwise host gene–microbe associations in lasso analysis. Number of host gene–microbe associations depicted by darkness of shading; green and purple shading reflect effect in rural and urban microbiomes, respectively (x axis). C, D Associative clusters between groups of taxa and groups of host genes in urban (C) and rural (D) samples Left text indicates groups of microbe taxa identified by canonical correlation analysis as having associations with groups of host genes. We only show associative clusters with significant over-representation. Right text indicates significant (FDR < 10%, gene count ≥ 3) host gene pathways enriched in each associative cluster. Dot size represents gene ratio: the proportion of input host genes that are annotated in a term. Blue dots indicate positive associations, orange dots indicate negative associations. Unless indicated by an asterisk (Anaerobutyricum), all microbes in a cluster act in the same direction. E-H Transcriptional response of host to microbe functions. E Similar to A, but with microbial pathways on the x axis. F Similar to B, but with microbial pathways on the y axis. G, H Similar to C, D, but considering microbial pathways. Groups of microbial pathways (left) and significant associated host gene pathways as identified by overrepresentation analysis (right).
FIGURE 4
FIGURE 4
A-D Associations between host lifestyle, microbe abundance, and host gene expression. A Left: Association of lifestyle features (x axis left; grouped by diet, medication use, general lifestyle, and blood markers) with the abundance of microbes (y axis). Far right: number of host genes (x axis) that associate with each microbe (y axis) per lasso analysis. For simplicity, microbes are only shown if >= 1 association with a host lifestyle feature and >=2 associations with host genes. Circle indicates a significant (FDR < 10%) association between microbe and lifestyle. Dot size corresponds to absolute effect size of coefficient. Blue dots represent positive associations, orange dots represent negative associations. B, C, D Rectangles represent lifestyle features collected from survey data of stool donor participants. Circles represent microbe taxonomy. Triangles represent individual host genes and host pathways that are enriched from host genes. Lines between rectangles and circles represent significant (Holm-corrected p < 1×10⁻¹) associations via differential abundance testing. Blue lines indicate positive associations, orange lines indicate negative associations. Arrows between circles and triangles represent significant (FDR < 10%) associations via lasso analysis. E-G Associations between host lifestyle, microbe function, and host gene expression. E Similar to A; microbe functions instead of microbe taxonomy on y axis. F, G similar to B, C, D; circles represent microbe function instead of microbe taxonomy.

References

    1. Manor O, Dai CL, Kornilov SA, Smith B, Price ND, Lovejoy JC, et al. Health and disease markers correlate with gut microbiome composition across thousands of people. Nat Commun. 2020;11:5206. - PMC - PubMed
    1. Shanahan F, Ghosh TS, O’Toole PW. The healthy microbiome-what is the definition of a healthy gut microbiome? Gastroenterology. 2021;160:483–94. - PubMed
    1. Parizadeh M, Arrieta M-C. The global human gut microbiome: genes, lifestyles, and diet. Trends Mol Med. 2023;29:789–801. - PubMed
    1. Rosas-Plaza S, Hernández-Terán A, Navarro-Díaz M, Escalante AE, Morales-Espinosa R, Cerritos R. Human gut microbiome across different lifestyles: From Hunter-gatherers to urban populations. Front Microbiol. 2022;13:843170. - PMC - PubMed
    1. Abdill RJ, Graham SP, Rubinetti V, Ahmadian M, Hicks P, Chetty A, et al. Integration of 168,000 samples reveals global patterns of the human gut microbiome. Cell [Internet]. 2025. [cited 2025 Feb 6];0. Available from: http://www.cell.com/article/S0092867424014302/abstract

Publication types

LinkOut - more resources